
Digital and health literacy

 Digital and health literacy index
Southampton City Council have developed a Digital and Health Literacy Index (DHLI), combining a set of ten indicators by LSOA (Lower level super output areas). They have also been split into two sections; The Digital Literacy Index (DLI) and the Health Literacy Index (HLI). The evidence-based range of indicators provide an understanding of potential digital and health literacy need across the city. Information about the indicators for each index can be found in the supporting document.
Each index can be used to identify specific challenges related to digital literacy or health literacy, combining the indexes highlights areas where residents may experience multiple and overlapping barriers. This is important because digital skills alone may not be enough to improve access to services or information. Residents may be able to access information online but still face challenges understanding, evaluating and acting upon that information, or navigating services and making informed decisions about their health. Also, strong health literacy may not mean better access to information where digital barriers remain.
By identifying areas where these challenges may coexist, the DHLI can support service design, commissioning decisions, policy development and targeted interventions. As health and community services continue to expand their digital offer, understanding where residents may face multiple barriers can help ensure that services are planned with the right support in place. This includes:
- providing appropriate support for residents who may face digital, health literacy or combined barriers;
- maintaining alternative routes of access where digital services may not be suitable or sufficient;
- tailoring communication so information is clear, accessible and easier to act on
 The DHLI map highlights areas where residents may experience challenges across both digital and health literacy. The top 5 LSOAs with the greatest digital and health literacy need are:
- E01017182
- E01017250
- E01017181
- E01017166
- E01017211
Four of the five highest-ranking LSOAs are located within the West and West Central Neighbourhood Areas, with the remaining LSOA situated within the North East Neighbourhood Areas. This clustering suggests that some parts of the city could experience a concentration of factors associated with both digital and health literacy need.
The indicators used in this dashboard are proxy measures, rather than direct measures of digital or health literacy. The indicators can be used to identify patterns of need to support discussion and be used alongside local knowledge, community engagement and other evidence.
The dashboard can be used to explore the overall index score and the contribution of individual indicators in more detail. More information can be found in the Digital & Health Literacy Index dashboard available below.
Health and Digital Literacy Index dashboard
Visualisation
Health literacy
Health literacy refers to having the skills, knowledge and confidence to be able to access, understand, evaluate and navigate health services. Individuals with low health literacy experience the poorest health outcomes (Public Health England, 2015). The World Health Organisation (WHO), in their Local action on health inequalities resource, describe health literacy as a critical determinant of health, influencing people's ability to access, understand and apply health information to make informed decisions.
In England, 42% of working age adults are unable to understand and use everyday health information. This rises to 61% when numeracy skills are also required for understanding (Rowland et al, 2015). Improving health literacy and those statistics has the potential to reduce these health inequalities (Public Health England, 2015), improve health outcomes as well as reducing associated health care costs (WHO).
Health literacy index
There is limited data when it comes to directly measuring health literacy. Southampton City Council have created a Health Literacy Index (HLI) including seven indicators as a proxy measure for health literacy among Southampton residents. The index can be used to understand the need in Southampton, helping to support decision making when it comes to developing interventions, service design, commissioning plans and policies. The HLI can also support conversations around where health information may need to be communicated differently to improve resident access to services. The index and related indicators can be explored in the interactive Health Literacy Index dashboard.
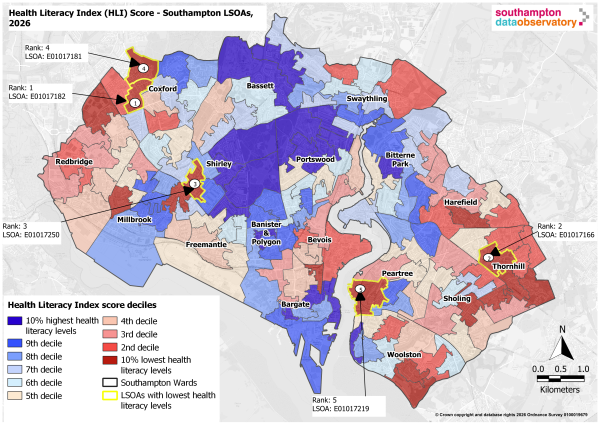
The HLI map highlights variation in health literacy across Southampton.The five LSOAs with the highest health literacy need (indicating areas where health literacy challenges are greatest according to the index) are:
- E01017182
- E01017166
- E01017250
- E01017181
- E01017219
These LSOAs can be seen on the map highlighted with a yellow edge and a call out with the rank and LSOA code.
The areas with the highest HLI need scores are not concentrated in one single part of Southampton. Instead, the areas are spread across several Neighbourhood Areas. The distribution of high scoring areas suggest that factors associated with health literacy need are present across a range of communities. This indicates that city-wide approaches may be needed alongside more targeted local action in the highest-scoring LSOAs.
LSOA E01017182 ranks first in the HLI and is located in the Coxford ward within the West Neighbourhood Area (NA). Its high overall ranking is driven by consistent high levels of need across multiple measures, featuring in the top five for four of the seven indicators included in the index.
The second highest ranked area, LSOA E01017166, presents a slightly different profile. Although it appears in the top five for overall index score, it is in the top five for two of the seven indicators included in the index. It ranks first for missed appointment rate indicator and second for the deprivation indicator. While it also falls within the top 10% of values for residents with no qualifications, this demonstrates how particularly high levels of need in few areas can influence an area’s overall rank.
Together, these examples demonstrate that high index scores can arise from different underlying profiles. Some areas rank highly because they experience elevated need across multiple indicators, while others are driven by a smaller number of indicators with high need. This reinforces the importance of exploring both the overall index score and the underlying indicators when seeking to understand local patterns of need and identify opportunities for targeted action.
It is important to interpret the HLI as an indication of need rather than a direct measure of health literacy. The indicators included in the index are associated with health literacy, but they may also be influenced by other factors. The HLI should be used as a starting point for understanding potential need, alongside local knowledge and further engagement with communities.
More information can be found in the Digital & Health Literacy Index dashboard available below.
Health and Digital Literacy Index dashboard
Visualisation
Digital literacy
Digital literacy refers to the skills, confidence and ability needed to access and engage with digital technologies and online services (Good Things Foundation Digital inclusion: What the main UK datasets tell us). These skills are becoming increasingly important as organisations seek to improve efficiency and modernise services, with many services now involving a digital element. While digital technology can improve access to information, services and healthcare, there is a risk that residents with limited digital literacy may be excluded from these benefits and face barriers to accessing health services.
An article from PLOS Digital Health (Digital literacy as a new determinant of health: A scoping review) found that harnessing new digital technologies can improve access to health care but can also widen the health divide for those with poor digital literacy.
Residents who face barriers to accessing digital technology may be at greater risk of experiencing poorer mental and physical health and missing out on opportunities and services. This has been termed ‘digital disadvantage’ (Ofcom -Exploring how people in the UK are affected by ‘digital disadvantage’).
Digital exclusion disproportionally affects demographic groups that already face other forms of disadvantage (NHS England - Developing digital literacy with people who have low or no digital skills). Supporting those individuals can help reduce inequalities across the city.
Digital literacy index
Southampton City Council have developed 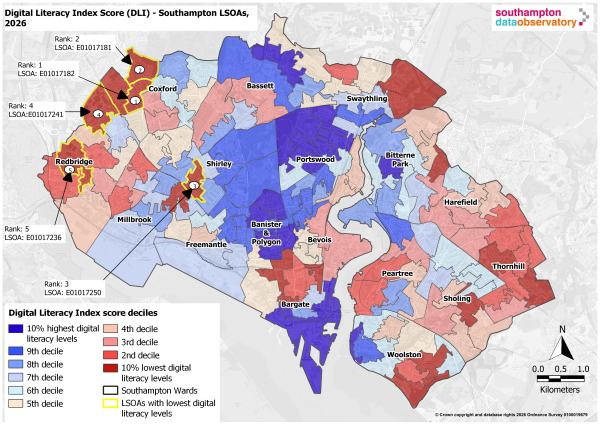 a Digital Literacy Index (DLI) for Southampton, comprises eight indicators. The DLI shows considerable variation across Southampton, with scores ranging from 12.79 to -11.67. The wide spread of DLI scores suggests variation in digital literacy related need across Southampton. This indicates that the risk of digital exclusion is not evenly distributed and that residents in some areas may face considerably greater barriers to accessing digital services than others.
The DLI map shows that the risk of digital exclusion is somewhat geographically concentrated for the top 5 scoring LSOAs. Four out of the five LSOAs with the highest DLI scores (areas of higher need according to the index) are located within the West neighbourhood area, with the remaining LSOA in the top five situated in West Central neighbourhood area.
The top 5 LSOAs where there is greatest digital literacy need are:
- E01017182
- E01017181
- E01017250
- E01017241
- E01017236
These areas are highlighted on the map with a yellow boundary, indicating that the greatest need for support, to reduce the risk of digital exclusion, is concentrated in the western part of the city.
As with the HLI, LSOA E01017182 ranked highest in the DLI. Its position is driven by consistently high levels of need across the underlying indicators, ranking within the highest 10% of values for six of the eight indicators included in the index. Of these six indicators, the LSOA ranked among the five highest-scoring areas in Southampton for five, demonstrating that its overall ranking is not driven by a single factor but by a broad range of digital literacy-related challenges.
LSOA E01017182 ranked highest for the Digital Propensity Index, an indicator within the DLI, and a measure of the likelihood that households will engage with online services. Given the increasing use of digital platforms to access health information and services, this indicator provides valuable insight into where barriers to digital engagement may exist. The high ranking suggests that residents in this area may be at greater risk of digital exclusion and may benefit from additional consideration when designing or implementing digitally enabled services.
It is important to interpret the DLI as an indication of need rather than a direct measure of digital literacy. The index uses a range of proxy indicators associated with digital literacy and the risk of digital exclusion. The DLI should be used as a starting point to understand the potential need and identify areas where additional investigation, local knowledge and community engagement may be beneficial.
More information on the DLI can on found in the Digital & Health Literacy Index dashboard available below.
Health and Digital Literacy Index dashboard
Visualisation
Resources
Digital & Health Literacy Index dashboard
This dashboard explores levels of digital and health literacy across Southampton's neighbourhood areas and sub-city areas. Users can view the overall Digital & Health Literacy Index, the Digital Literacy Index, the Health Literacy Index, or explore the individual indicators that contribute to each index. The indices have been created using a standardisation method called z-scoring, which allows different indicators to be compared on the same scale. Scores are then grouped into deciles to highlight areas that may experience greater challenges and could benefit from targeted support.
Health and Digital Literacy Index dashboard
Visualisation
Digital & Health Literacy Index supporting documentation
Digital & health literacy index supporting documentation and information.
Digital & Health Literacy Index supporting document
Report
Digital & health literacy maps (2026)
These maps display the Digital & Health Literacy Index scores, Digital Literacy Index scores and Health Literacy Index scores across Southampton. Scores are grouped into deciles, highlighting areas where levels of digital and health literacy may be lower and where additional support may be beneficial.
Digital & Health Literacy Map
Health Literacy Map
Digital Literacy Map
Z-scoring methodology
This PowerPoint explains the methodology of Z-Scoring which has been used to calculate the digital and health literacy scores.
Z-Scoring methodology
pdf | 542.9 KB
Health literacy links
Links relating to health literacy which have been referenced on this webpage.
Public Health England - Local action on health inequalities
Website
World Health Organisation - Low health literacy is costing health
Report
A mismatch between population health literacy and the complexity of health information
Report
Digital literacy links
Links relating to digital literacy which have been referenced on this webpage.
NHS England - Developing digital literacy with people who have low or no digital skills
Website
PLOS Digital Health - Digital literacy as a new determinant of health
Report
Ofcom - Exploring how people in the UK are affected by ‘digital disadvantage’
Website
Good Things Foundation - Digital inclusion: What the main UK datasets tell us
Website
Last updated: 24 August 2026