Population size and structure
Southampton’s population size and structure
 Understanding the size and structure of Southampton’s population and how it is changing is vital in estimating population need and for the planning and commissioning of services across the city. Data on Southampton’s population comes from a range of sources, using different methodologies for estimating the size and structure of the population and how this is projected to change in the future. These are summarised below, whilst links to the data and visualisation tools can be found in the resources section at the end of this page.
Residential population estimates
 The Mid-year population estimates (MYE) are produced annually by the Office for National Statistics based on data from the latest Census, migration, births and deaths (known as natural change).
This estimate in known as the “usually resident population” and includes only people who have lived in the country for over 12 months. Visitors and short-term migrants are excluded. The MYE covers all of England,regions, local authorities and down to Lower Level Super Output Areas (LSOA), small areas covering between 1,000 and 3,000 people, there are 152 in Southampton.
A summary of the main points is provided below:
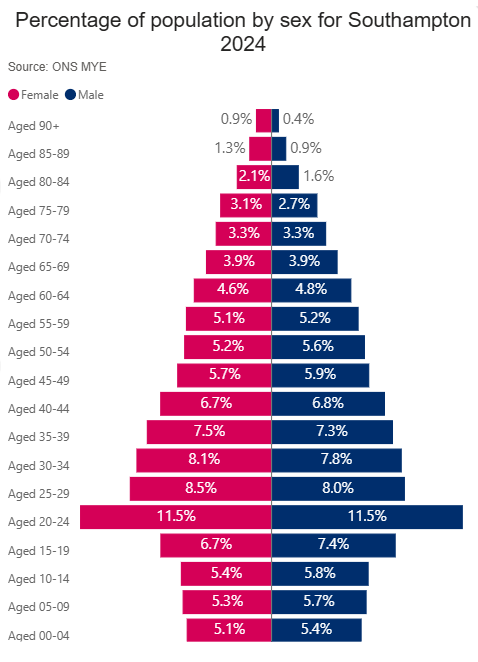
- In 2024, the resident population of Southampton was estimated to be 259,424, of which 128,859 (49.7%) are male and 130,565 (50.3%) are female
- Children between the ages 0 to 5 make up 6.3% (16,359) of the population, which is lower than the England average of 6.4%
- 17.4% (42,259) of Southampton’s resident population is aged between 16 and 24 years higher when compared to 10.8% in England. This is largely due to Southampton being a university city and home to approximately 37,800 students
- 13.7% (35,555) of the population are aged 65 and over which is lower than the England average of 18.7%
The main changes in Southampton wards are:
- Banister & Polygon has the largest ward population of 18,742 people or 7.2% of Southampton’s population
- The smallest ward, in population terms, is Harefield with a population of 13,585 people or 5.2% of Southampton’s population
- Swaythling (35.9%), Banister & Polygon (34.8%) and Bargate (29.3%) have the largest population aged 16 to 24 years reflecting the large student population in Southampton
More information on the ONS MYE can be found in the population estimate tool below and the resources section.
Southampton population dashboard
Visualisation
Small Area Population Forecast (SAPF)
Another way of looking at the resident population is using the Small Area Population Forecasts (SAPF) from Hampshire County Council, these estimates provide local estimates of the current and future resident population as they take account of natural change (births and deaths), internal and international migration and known and planned dwelling completions. The SAPF covers Hampshire, Portsmouth and Southampton. The estimates also include future dwellings supply based on residential planning applications.
The latest SAPF population projections run from 2024 to 2031 and suggest that the population of Southampton in 2026 is 257,976. The overall resident population is projected to increase by 4.6% (11,966 people) between 2026 and 2031. To 269,941 in 2031.
The number of dwellings is forecast to increase from 111,531 in 2026 to 117,306 in 2031; an increase of 5.2% (1,775 extra dwellings).
The largest growth in dwellings, in the same period, is predicted to be in Bargate (4,151 extra dwellings; 48.5%), followed by Bitterne Park (378 extra dwellings; 5.5%) and Banister & Polygon (299 extra dwellings; 5.5%). The smallest growth in dwellings is predicted to be in Coxford (5 extra dwellings 0.1%).
Detailed SAPF data including wards, neighbourhoods and by deprivation can be found in the population dashboard below or in the resources section the end of the page.
Southampton population dashboard
Visualisation
Subnational population projections (SNPP)
The SNPP from the Office for National Statistics take the mid-2022 population estimates, as their starting point and project the population to 2047. The projected local authority populations for each year are calculated by ageing on the population from the previous year, applying local fertility and mortality rates to calculate the number of projected births and deaths, and then adjusting for migration into and out of each local authority. The latest SNPP data runs from 2022 to 2047 and suggests that Southampton’s population by 2047 will be 281,498 and increase of 5.5% or 14,652 people between 2026 and 2047.
The SNPP are not forecasts. They do not consider possible future changes in international migration, or of population changes that could result from economic growth or housing policies. These factors are outside the scope of the projections.
The assumptions used for future fertility, mortality and migration are based on past trends. As a result, the projected figures are likely to differ from population estimates published in future years.
More details can be found in the population change section and in the dashboard below and resources section.
Southampton population dashboard
Visualisation
GP registered population
An alternative source of population data comes from GP practice registers; these provide the number of patients registered with a Southampton GP practice. The registered population differs from the resident population as a person can be registered with a Southampton GP practice but live outside the city, or may live in the city, but be registered with a GP practice outside of Southampton. For this reason, the registered population can be quite different to the resident populations. The GP registered population is particularly useful for the planning of public health services.
NHS Digital collates the registered population at GP surgery and Primary Care Network (PCN). The data is available by age and gender and is released monthly. In February 2026, there were 336,323 people registered at a Southampton GP, of which 162,303 (48.3%) were female and 174,020 (51.7%) were male.
More information on GP surgeries and PCN is available in the population dashboard in the resources section below.
Resources
Population dashboard
The dashboard presents a range of population data to provide intelligence on Southampton's resident and GP registered population to help drive strategic decision making. Data in this dashboard is compiled from a range of publicly available sources. Including Small Area Population Forecasts (SAPF), Mid-Year Population Estimates (MYE), Subnational Population Projections (SNPP) and GP Registered Populations. Please note that SAPF figures in the dashboard are the sum of all Lower Level Super Output Areas (LSOA) and may not be the same as other published figures.
Southampton population dashboard
Visualisation
ONS - Mid-Year Population Estimates (MYE)
The Mid-Year Population Estimates (MYE) are produced by the Office for National Statistics and provide comparable resident population data across the whole country by quinary (5 year) and single age year bands. The estimates are calculated by rolling forward the 2021 Census results, taking into account natural change (births and deaths) and internal and international migration between 1 July and 30 June each year. Data is produced annually and is available at various geographies including local authorities.
ONS - Population estimates for England and Wales: mid-2024
Report
ONS - Estimates of the population for England and Wales
Dataset
ONS - Analysis of population estimates tool for UK
Dataset
ONS Mid-Year Population Estimates (MYE) for small areas
Population estimates for output areas, lower layer Super Output Areas (LSOAs), middle layer Super Output Areas (MSOAs), electoral, health and other geographies for mid-2023 and mid-2024. In addition, estimates for mid-2022 have been revised to be consistent with revised local authority level estimates for mid-2022.
ONS - Population estimates by output areas, electoral, health and other geographies
Dataset
Hampshire County Council - Small Area Population Forecasts (SAPF)
The Small Area Population Forecasts (SAPF) are produced by Hampshire County Council and cover Hampshire, the local districts, Portsmouth and Southampton. These figures are based on natural change (births and deaths), internal and international migration and known dwelling completions. They also include future dwellings supply based on residential planning applications. The SAPF data is available for Local Authorities, wards and Lower Level Super Output Areas (LSOA), allowing the creation of defined smaller areas or community data.
Hampshire County Council Small Area Population Forecasts (SAPF)
Dataset
ONS - Subnational population projections (SNPP)
The projections take the mid-2022 population estimates, published on 24 June 2025, as their starting point and project the population to 2047. The projected local authority populations for each year are calculated by ageing on the population from the previous year, applying local fertility and mortality rates to calculate the number of projected births and deaths, and then adjusting for migration into and out of each local authority.
ONS - Subnational population projections (SNPP)
Dataset
NHS England - Patients registered at a GP practice
The number of patients registered at a GP on the first day of each month. Presented at practice, PCN, ICB sub-location, ICB and NHS England Commissioning Region level. LSOA data are published quarterly. Data is released in single year of age and 5-year age bands, split by gender.
NHS England - Patients Registered at a GP Practice
Dataset
Census 2021 interactive dashboard
Users can access a range of Census data across different topic areas including population, education, identity, housing, health and work. With the ability to view benchmarking between Southampton and ONS comparators and mapping of data by Census geographies; such as lower layer super output areas (LSOA) a neighbourhood of around 1,500 residents.
Census 2021 dashboard
Visualisation
NOMIS – 2021 Census data
The 2021 Census was taken on 21st March 2021. The data from this census are available in several hundred separate datasets (or tables), covering the whole range of population characteristics and subject areas. These data tables can be queried through the Census NOMIS website. Data from the 2001 and 2011 Census is also available on Nomis. A link to NOMIS is provided below.
Nomis - Census data
Dataset
Last updated: 16 June 2026