Young offenders
 Young Offenders
Southampton has a relatively young age profile, with the population aged 10 to 24 years predicted to grow by +8.5% by 2030. There is evidence to suggest that young people can be at a higher risk of becoming involved in crime, either as a victim or an offender. The likelihood of a young person becoming involved in crime increases with negative risk factors such as, but not limited to experiencing adverse childhood experiences, family conflict, poor attendance and exclusion from school. 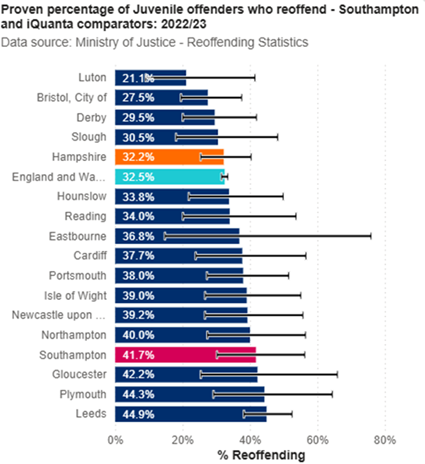 These risk factors highlight the importance of early intervention to prevent young people from becoming involved in crime in the first place.
13.8% of victims and 14.1% of suspects or offenders identified in Southampton in 2024/25 were aged under 18 years. The risk of young people becoming involved in crime also varies across crime groups, with certain crimes skewed towards younger age profiles, for example violent crime.
41.7% of the 2022/23 youth offending cohort in Southampton reoffended, higher, but not significantly than the England and Wales average (32.5%). Although these figures may seem high, it is important to note that figures for Southampton are based on a small cohort of youth offenders (103 offenders and 43 reoffenders).
A summary report and slide set produced as part of the 2024/25 Strategic Assessment are available to download below. The interactive community safety dashboard can be accessed using the link below. For more information on crime in Southampton, see the Safe City Strategic Assessment page.
Community Safety Dashboard
Visualisation
Resources
2024/25 Safe City Strategic Assessment
The Southampton Safe City Strategic Assessment provides an overview of current and future crime, disorder and community safety issues affecting Southampton and makes recommendations to enable the Partnership to focus the Safe City Strategy and local delivery plans. The report and slide set that informed the assessment are available below to download. The interactive community safety dashboard can be accessed using the link below.
2024/25 Safe City Strategic Assessment report
2024/25 Safe City Strategic Assessment presentation
pdf | 5.7 MB | 12.12.2025
Community Safety Dashboard
Visualisation
Archived assessments
This section contains archived reports from previous Safe City Strategic Assessments. For the latest report and data on crime and community safety in the city, see the Safe City Strategic Assessment above.
2023/24 Safe City Strategic Assessment report
2022/23 Safe City Strategic Assessment report
2021/22 Safe City Strategic Assessment report
2020/21 Safe City Strategic Assessment
2019/20 Safe City Strategic Assessment
2018/19 Safe City Strategic Assessment
2017/18 Safe City Strategic Assessment
2016/17 Safe City Strategic Assessment
2015/16 Safe City Strategic Assessment
2014/15 Safe City Strategic Assessment
Last updated: 05 January 2026