Migration
 Migration in Southampton
In recent decades, high levels of economic migration from Eastern Europe into Southampton have contributed to the development and sustainability of many business activities, thereby bringing in greater richness and diversity to city life. In addition, strong community relations over many decades have contributed to maintaining cohesiveness in the city.
Recent data released from the 2021 Census includes information on country of birth, passports held and year and age of arrival in the UK.
Also available are a set of interactive maps of the most recent data. The maps can be accessed directly from the 2021 Census Maps page from the Office for National Statistics. More information is available in the Census 2021 dashboard that can be found below and in the resources section at the end of the page.
Census 2021 dashboard
Visualisation
Country of birth
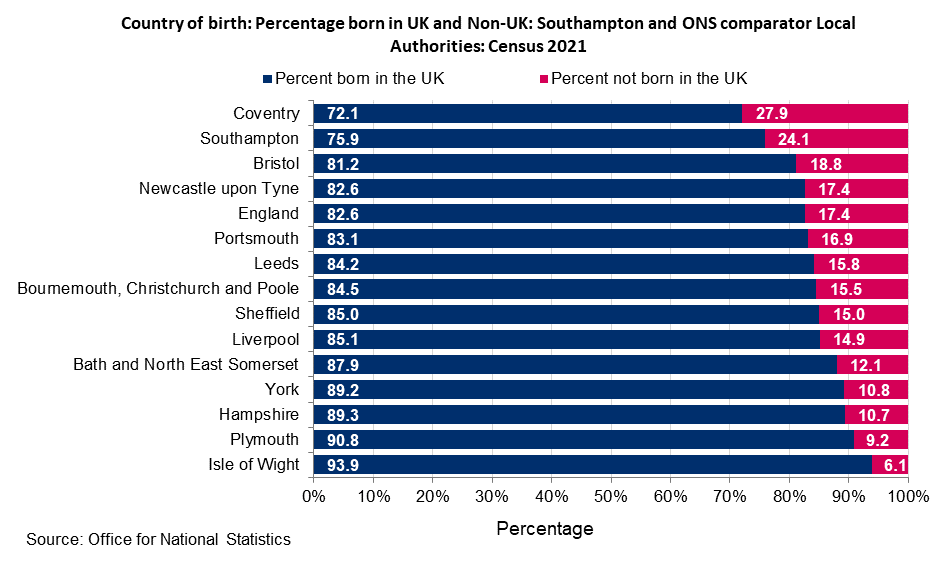 Census 2021 data shows that 75.9% (188,823) of Southampton’s population (248,922) were born in the UK, whilst 24.1% (60,098) were born outside the UK. Since 2011, there has been a 44.3% increase in the number of people born outside the UK in Southampton, rising from 41,651 in Census 2011 to 60,098 in Census 2021. The number of people born in the UK fell by -3.3% from 195,231 in 2011 to 188,823 in 2021. Amongst ONS comparator areas, only Coventry has a higher percentage of its population born outside the UK (27.9%).
Looking in more detail at those people who were born outside the UK, the largest increases are people from the Romania, Portugal, Spain and ‘other European’ countries. The largest falls are people from Scotland, Ireland, New Zealand, Canada and Northern Ireland.
The number of people born in Romania increased from 369 people in 2011 to 3,794 people in 2021, an increase of 928.2%. The Romanian population in Southampton is now over 10 times larger than in 2011 and higher than the percentage increase across the UK (576% increase). This increase was largely driven by working restrictions for Romanian citizens being lifted in 2014. The next largest increase was in the Portuguese population, which is over 300% larger or 4 times as many than in 2011 (454 in 2011 to 1,818 in 2021). The third largest increase was in the Spanish population which increased from 392 in 2011 to 1,095 in 2021, 2.8 times higher.
Across the UK population, the three most common non-UK countries of birth in 2021 were the same as in 2011, namely India, Poland and Pakistan. The number of people born in Romania increased to 539,000 in 2021 an increase 459,000 (576%), making Romania the fourth most common non-UK country of birth.
More information is available in the Census 2021 dashboard that can be found below and in the resources section at the end of the page.
Census 2021 dashboard
Visualisation
Passports held
 In the 2021 Census, people could record multiple passports held. To prevent double counting the number of residents with multiple passports, the Office for National Statistics (ONS) only includes passport holders in one category, in the following hierarchy:
- UK passport
- Irish passport
- Other country passport
This means that someone with three passports, including a UK passport, would only be included in the UK passport category.
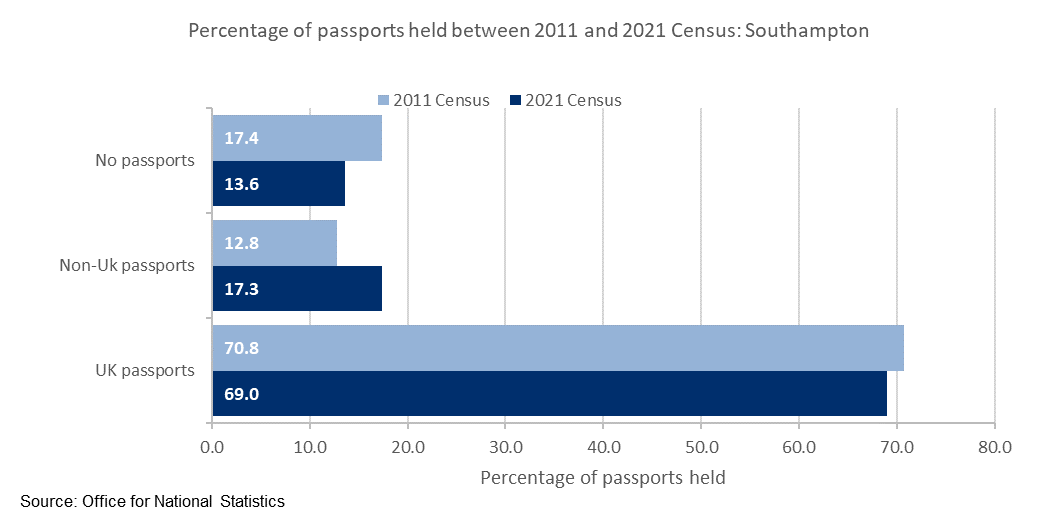
In the UK, in the 2021 Census, 51.6 million usual residents (86.5%) held at least one passport, and 8.0 million (13.5%) did not have a passport, down from 9.5 million (16.9%) in 2011. Those who held a UK passport increased, from 42.5 million (75.7%) in 2011 to 45.7 million (76.7%) in 2021. Those who held a non-UK passport also increased, from 4.2 million (7.4%) in 2011 to 5.9 million (9.9%) in 2021.
 In Southampton, 215,024 (86.4%) people held at least one passport, an increase of 8.6% between 2011 and 2021 Census. The number of residents with no passport fell by 17.8% to 33,897 (13.6% of the population) over the same time period. The number of people holding non-UK passports increased by 41.9% to 43,148 (17.3% of the population) between 2011 and 2021.
The largest number of passports held by non-UK born residents are from Poland, Romania, Portugal and India. See the chart for the top 10 number of passports held. Polish passport holders increased from 5,886 in 2011 to 12,393 in 2021 an increase of 6,507 (110.6%). Romanian passport holders increased from 277 in 2011 to 3,625 in 2021, an increase of 3,348 (1,208.7% increase).
More information is available in the Census 2021 dashboard that can be found below and in the resources section at the end of the page.
Census 2021 dashboard
Visualisation
Year and age of arrival
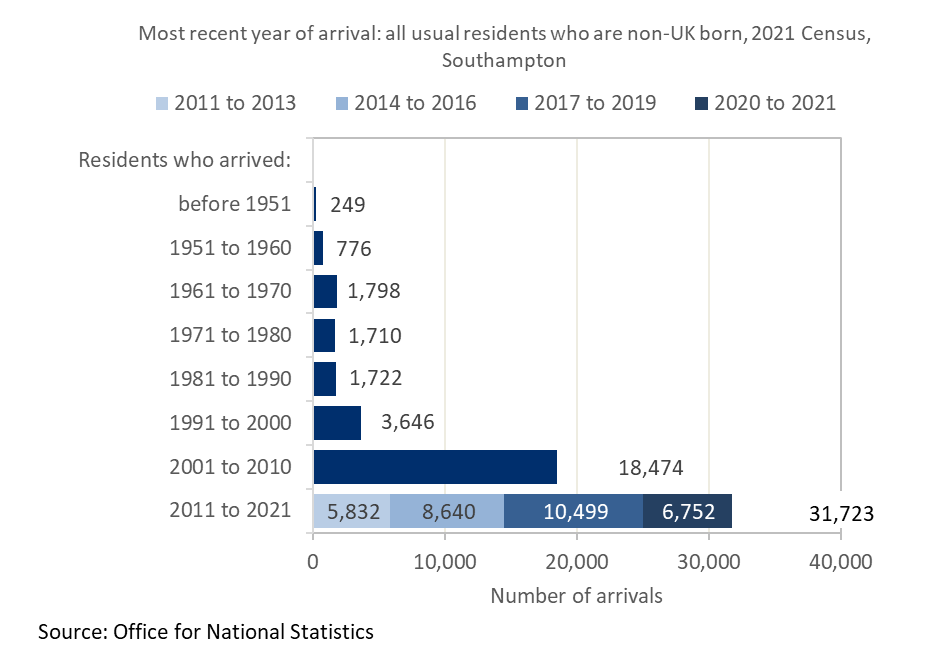
As part of the 2021 Census, residents born outside the UK were asked when they most recently arrived to live in the UK. Combining this with their date of birth allows us to understand the age on arrival of these residents. Of the 60,099 Southampton residents who were not born in the UK:
- 31,723 (52.8%) had arrived since 2011 (compared with 42.4% in the UK)
- 18,474 (30.7%) had arrived between 2001 and 2010 (compared with 26.9% in the UK)
- 9,901 (16.5%) had arrived before 2001 (compared with 30.7% in the UK)
Therefore, over half (52.8%) of residents in Southampton who were born outside the UK, arrived in the city over the last decade (since 2011). This is higher than the England average (42.4%) and the third highest amongst ONS comparator areas, with only Liverpool (59.6%) and Newcastle (55.5%) having higher proportions.
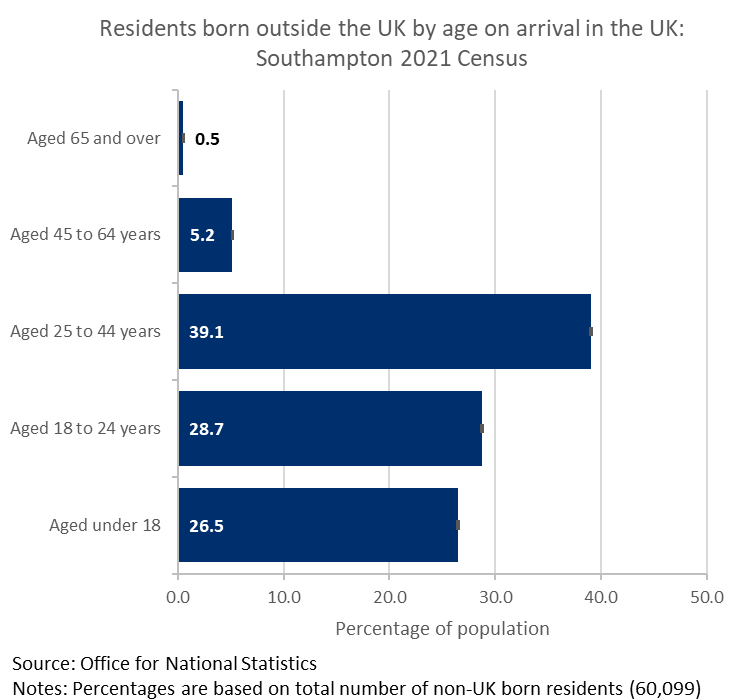 Of the 60,099 non-UK born residents in Southampton, the majority were of working age when arriving in the UK, with the greatest proportion aged between 25 to 44 years:
- 26.5% (15,937) non-UK born usual residents were below the age of 18 years when they arrived in the UK, compared with 30.2% across the UK
- 28.7% (17,263) were aged 18 to 24 years compared with 25.3% across the UK
- 39.1% (23,484) were aged 25 to 44 years compared with 38.2% across the UK
- 5.2% (3,105) were aged 45 to 64 years compared with 5.5% across the UK
- Only 0.5% (310) were aged 65 years and over compared with 0.8% across the UK
More information is available in the Census 2021 dashboard that can be found below and in the resources section at the end of the page.
Census 2021 dashboard
Visualisation
Internal migration
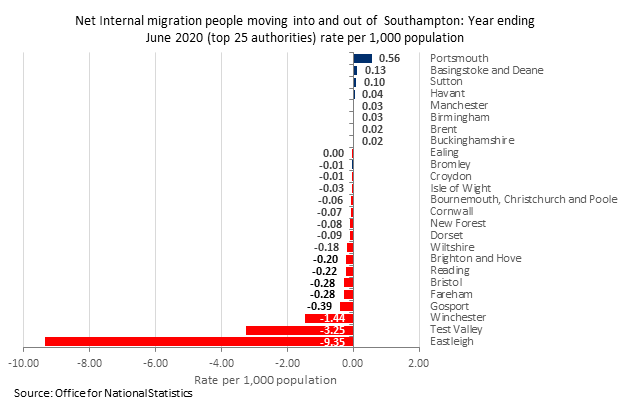 Figures on internal migration, from the 2021 census, are due to be released soon. Data currently available for internal migration between areas in the UK, is up to the end of June 2020. It shows that more people have left Southampton than have arrived. Just over 15,500 people arrived in the city and just over 19,000 left the city since 2019, giving a net internal migration of -3,536 or -13.6 people per 1,000 population. Southampton is not alone in having net negative internal migration, with 120 local authorities in England having more people moving out than in, many of which are in London. Southampton is ranked 17th highest negative net internal migration with Birmingham having the highest loss of -13,256 people in the same period.
This data does not include movements of people during the COVID-19 pandemic, it is anticipated that the numbers will be lower in the last two years due to nationally imposed restrictions on movement.
Unsurprisingly, areas with the largest internal migration to and from Southampton are neighbouring authorities. In particular, there is a close relationship with Eastleigh with 1,105 people migrating into the city from Eastleigh, between 2019 and 2020, and 2,373 moving from Southampton to Eastleigh. This is a net migration of -1,267 people to Eastleigh or -9.35 people per 1,000 population. The chart illustrates the top 25 areas with migration to and from Southampton.
Resources
Census 2021 interactive dashboard
Users can access a range of Census data across different topic areas including population, education, identity, housing, health and work. With the ability to view benchmarking between Southampton and ONS comparators and mapping of data by Census geographies, such as lower layer super output areas (LSOA) a neighbourhood of around 1,500 residents.
Census 2021 dashboard
Visualisation
Census 2021 - slide set and data compendium
Data releases from the 2021 Census, compared with 2011 Census and other population estimates. Results include population by age and sex, population density, migration and households. A summary slide set and a data compendium comparing Southampton, ONS comparators and England can be downloaded using the links below.
Census 2021 results
pdf | 1.6 MB | 30.05.2023
Census 2021 data compendium
Home Office - How many people come to the UK irregularly?
Information from the Home Office on the number of irregular migrants entering the UK.
Home Office - How many people come to the UK irregularly?
Website
ONS - Geographical mobility of young people across English towns and cities: March 2024
ONS has published a cohort analysis using the Longitudinal Education Outcomes dataset exploring the link between education attainment and geographical mobility of young people in England between 2007 and 2019. It shows how educational attainment levels of young people are associated with different mobility patterns and, in turn, how geographical mobility differs across towns and cities with different place-based characteristics. This release also examines the extent to which towns and cities in England retain and attract qualified labour.
ONS - Geographical mobility of young people across English towns and cities: March 2024
Report
Tableau public - Census 2021 - maps by Jon Rumsey
ONS - Migration tools
The primary source of information on migration comes from the Office for National Statistics (ONS), who produce estimates of internal migration based on data from the NHS Personal Demographic Service and the Higher Education Statistics Agency (HESA) and estimates of international migration based on data from surveys such as the International Passenger Survey (IPS) and Labour Force Survey (LFS). The next updates are due in November 2023.
ONS - Internal migration: detailed estimates by origin and destination local authorities, age and sex
Report
ONS - Origin-destination data explorer: Census 2021
An interactive guide and tool, from the Office for National Statistics, for exploring the origin-destination data published for Census 2021. Origin-destination data show the movement of people from one location to another, such as migration and commuting patterns. It is sometimes known as "flow data". To see details for workplace flows scroll down and enter a postcode.
ONS - Origin-destination - Migration tool
Visualisation
ONS - Origin-destination interactive tool - Workplace tool
Visualisation
Last updated: 26 September 2023