ONS Health index
 Introduction to the ONS Health Index
Provisional data has been released for 2021 along with this statement from Office for National Statistics (ONS):
"Estimates are experimental and still under development. For 21 of 56 indicators, change may have been expected in 2021 but could not be measured because of unavailable or inconsistent underlying data. This most affects the Healthy Places domain and the overall Health Index value. Scores represent our best current assessment; data that become available will be added to future releases."
Once there has been a further release from ONS, we will update our data to the 2021 findings. Please see below for data on the Health Index for 2015-2020. If you wish to see 2021 figures, please visit the Hampshire ONS Health Index Power BI available below and in the resources section.
Hampshire and Isle of Wight Public Health - ONS Health Index: 2015-2021
Visualisation
What is the Health Index?
The ONS created the Health Index as a new way of measuring the health of the nation and It supports the World Health Organization’s (WHO’s) definition of health, that health “is a state of complete physical, mental and social well-being, and not merely the absence of disease or infirmity”. It uses a broad definition of health which includes:
- health outcomes
- health-related behaviours and personal circumstances
- wider drivers of health that relate to the places where people live
The Health Index provides a single value for health to help understand trends over time and comparisons to other local authorities. It can be broken down into 3 main areas: Healthy People, Healthy Lives and Healthy Places, each containing several subdomains. The current release covers 2015 to 2020.
A score of 100 means health is equal to the baseline of health in England in 2015. Values higher than 100 indicate better health than England in 2015, and values below 100 indicate worse health. Regional and national-level scores can therefore be interpreted in the same way, in relation to health in England in 2015; more than 100 is better, 100 is the same, and less than 100 is worse. Less than one standard deviation of the data at these levels has scores between 90 and 110. The scale is such that a score of 110 represents a score that is one 2015 standard deviation higher than England 2015's score for that same indicator, a score of 80 is two standard deviations lower, and so on.
More information on the ONS Health index is available in the resources section below.
Hampshire and Isle of Wight Public Health - ONS Health Index: 2015-2021
Visualisation
 Health Index score
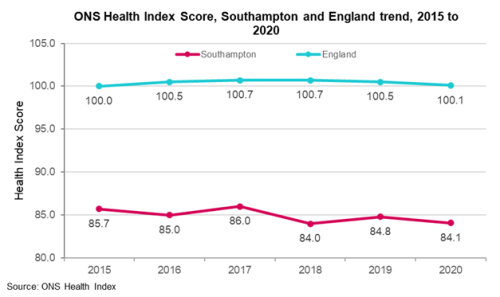
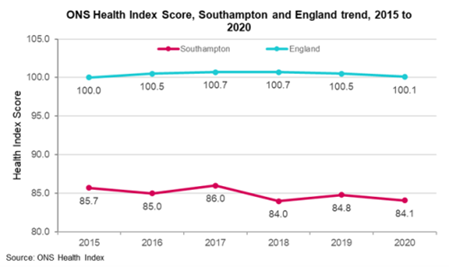
Southampton's Health Index score has remained lower than England’s since 2015, however follows a similar trend pattern. Southampton’s current Health Index score (2020) is 84.1, a decrease of 0.7 points compared to 2019 (84.8) and 16 points lower than England (100.1). Compared to England, ONS comparators and local neighbours, Southampton has the 2nd worst Health Index score for 2020. Liverpool has the worst with a score of 81.8 whilst Bath and Northeast Somerset has the highest of 111.3.
More information is available in the resources section below.
Domains
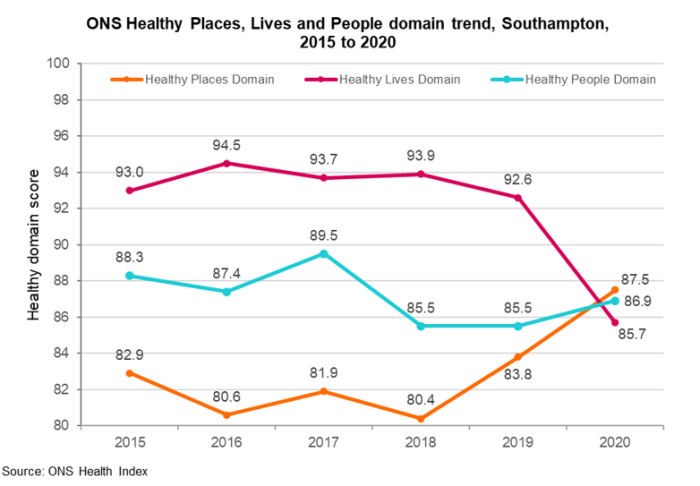 All 3 domain scores in 2020 are lower than 100, indicating a worse health than England in 2015. In 2020, Healthy Places domain score for Southampton is 87.5 (103.4 in England). Since 2015, Healthy Places has had the lowest score amongst the 3 domains with the worst score in 2018 of 80.4. However, it has significantly increased since and is now the highest domain score.
Healthy People domain has a score of 86.9 for Southampton (95.4 in England) in 2020. This has increased 1.4 points since 2019. Southampton’s highest score was 89.5 in 2017 however decreased to its lowest score (85.5) the following year.
Southampton’s score for Healthy Lives domain for 2020 is 85.7 (101.4 in England). This took a steep decrease of 6.9 points from 92.6 in 2019.
More information is available in the resources section below.
Subdomains
Southampton's best score across all subdomains is 108.7 for health relating to “difficulties in daily life” which looks at disability and frailty. “Frailty” measures hospital admissions as a result of a hip fracture in those ages 65 and over. Figures may have been affected by higher mortality rates in frailer people during the pandemic, or people being less exposed to injury while less active and staying at home.
The second highest scoring subdomain is “access to services” (104.1) which is also a 2019 IMD subdomain. The score for the South East is 97.0, while England has a score of 100.0. “Access to services” addresses distance to GP services, distance to pharmacies (also evidenced by the Pharmaceutical Needs Assessment), distance to sports of leisure facilities, internet access and patients offered acceptable GP practice appointments. In-person services in this category were limited during the coronavirus pandemic. The highest indicator in “access to services” was distance to sports or leisure facilities with an index value of 107.3 The lowest scoring indicator was patients offered acceptable GP practice appointments which has an index value of 81.2.
More information is available in the resources section below.
Healthy people
Compared to England and local neighbours Hampshire, Isle of Wight and Portsmouth, Southampton has the 2nd lowest score of 86.9 for Healthy People in 2020. Hampshire has the highest with a score of 97.8, higher than the national score of 95.4. Southampton's Healthy People score has been lower than England’s baseline score since 2015. The highest score for Southampton was 89.5 in 2017 and the lowest was 85.5 in 2018 and 2019.
More information is available in the resources section below.
Difficulties in daily life
Difficulties in daily life include the indictors “frailty” and “disability”. Southampton's difficulty in daily life score is 108.7, the highest and best against England and local neighbours and nearly one deviation higher than England in 2015. Southampton has a score of 113.1 for frailty, one standard deviation higher than England’s score in 2015 and the 2nd highest against England and local neighbours for 2020. Southampton has the highest score for disability with 101.1 which is the percentage of working-age adults (16-64) who are disabled under the Equality Act or work-limiting disabled.
More information is available in the resources section below.
Mental health
Southampton has a score of 80.3 for mental health, the lowest and worst against England and local neighbours and the worst score out of all subdomains. The score is nearly 2 standard deviations away from England’s score in 2015. When breaking the mental health sub-domains down, Southampton has the lowest score for self-harm (79.5) and children’s social, emotional and mental health (77.4), the 2nd lowest for mental health conditions (85.2) however the 2nd highest for suicides (101.4), also higher than England’s 2015 score.
More information is available in the resources section below.
Mortality
Mortality subdomain includes the indicators:
- mortality from all causes
- infant mortality
- avoidable mortality
- life expectancy
Southampton’s mortality score of 91.9 is the lowest and worst against England and local neighbours. Southampton has the lowest and worst indictor score for mortality from all causes (91.9) and infant mortality (91.9) and the 2nd lowest and worst for avoidable mortality (91.9) and life expectancy (94.1).
More information is available in the resources section below.
 Personal wellbeing
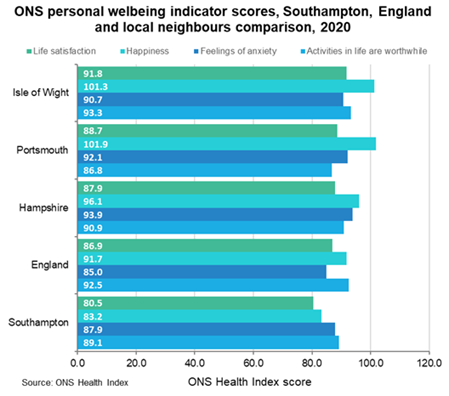

Southampton has the lowest and worst score of 82.3 for personal well-being, nearly 2 standard deviations lower than England in 2015. Isle of Wight has the highest score of 93.4. All scores, including England, are lower than England's score of 100 in 2015. For feelings of anxiety, Southampton has the 2nd lowest and worst score of 87.9. Southampton also has the 2nd lowest and worst score for activities in life are worthwhile (89.1).
Southampton has the lowest and worst score for life satisfaction (80.5), which is nearly 2 standard deviations lower and for happiness (83.2).
More information is available in the resources section below.
Physical health conditions
Physical health conditions include 7 indicators:
- Cancer
- cardiovascular conditions
- dementia
- diabetes
- kidney and liver disease
- musculoskeletal conditions
- respiratory conditions
Southampton has the 3rd lowest score of 92.6 for physical health conditions amongst England and local comparators. Of the 7 indicators, Southampton has the highest and best score for cardiovascular conditions, 107.0, nearly 1 standard deviation higher than England in 2015. Southampton has the 2nd highest score for dementia, 96.7.
More information is available in the resources section below.
Healthy lives
Southampton's Healthy Lives score has been lower than England’s baseline score since 2015. The highest score for Southampton was 94.5 in 2016. Southampton’s score has made a steep decrease from 92.6 in 2019 to 85.7 in 2020. Compared to England and local neighbours Hampshire, Isle of Wight and Portsmouth, Southampton has the lowest score for Healthy Lives, 85.7. Southampton is 15.7 points lower than England and 27.7 points lower than the highest score for Hampshire (113.4).
More information is available in the resources section below.
 Behavioural risk factors
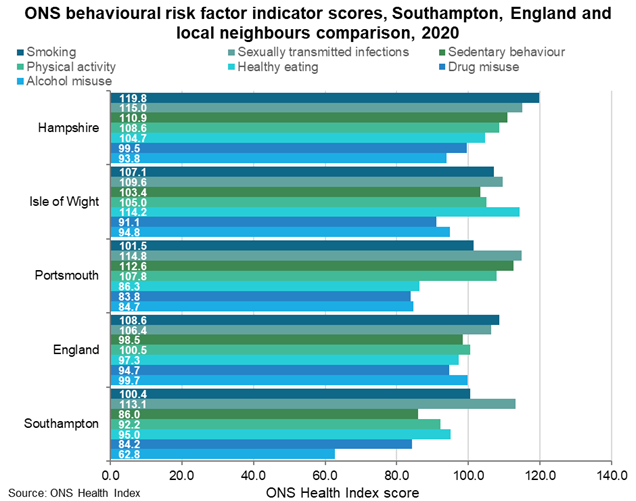
Behavioural risk factor domain includes the indicators:
- Smoking
- physical activity
- alcohol use
- sexually transmitted infections
- healthy eating
- sedentary behaviour
- drug use
Southampton's score for behavioural risk factors is 86.6, the lowest compared to England and local neighbours for 2020 and over 1 standard deviation lower than England 2015. Southampton’s has the lowest and worst score for physical activity (92.2), alcohol use (62.8), sedentary behaviour (86.0) and the 2nd lowest and worst score for healthy eating (95.0).
Although smoking (100.4) is the lowest score compared to England and local neighbours, it is better than England’s 2015 score.
More information is available in the resources section below.
Children and young people
Southampton’s children and young people score is 97.4, the second lowest compared to England and local neighbours and lower than England's 2015 score. Southampton’s has the 2nd lowest and worst scores for teenage pregnancy (99.1) and pupil absences (87.7), young people in education and employment (84.9), pupil attainment (99.5) and early years development (110.5). Pupil absences and young people in education and employment scores are over 1 standard deviation lower than England 2015.
More information is available in the resources section below.
 Physiological risk factors
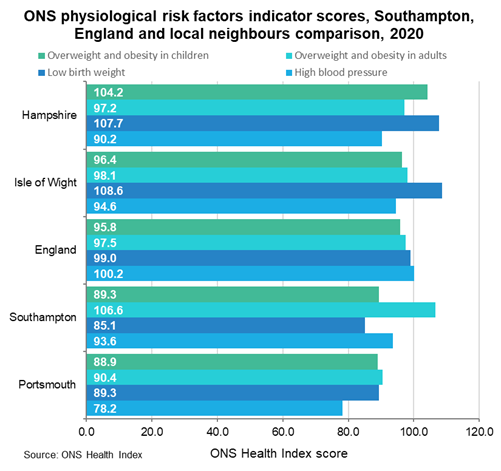
For physiological risk factors, Southampton has a score of 89.6, the 2nd lowest and worst compared to England and local neighbours and just over 1 standard deviation lower than England 2015.
Southampton has the lowest and worst score for low birth weight (85.1) over 1 standard deviation lower than England 2015. However, Southampton has the highest and best score for overweight and obesity in adults, 106.6. This is 8.5 points higher than the next highest score which is Isle of Wight (98.1) and also higher than England 2015.
More information is available in the resources section below.
Protective measures
Southampton has the lowest and worst score of 80.8 for protective measures compared to England and local neighbours, nearly 2 standard deviations below England 2015. Southampton has the lowest and worst scores for child vaccination coverage (75.7) and cancer screening attendance (89.9).
More information is available in the resources section below.
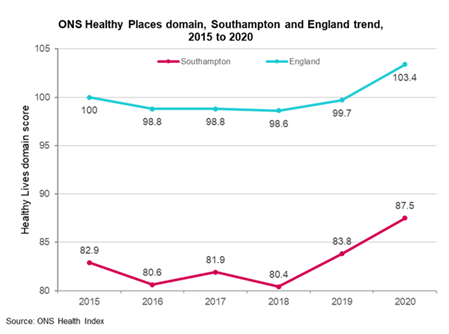 Healthy places

Compared to England and local neighbours Hampshire, Isle of Wight and Portsmouth, Southampton has the lowest score of 87.5 for Healthy Place. Southampton is 15.9 points lower than England (103.4) and 25.2 points lower than the highest score for Hampshire (112.7).
Southampton's Healthy Places score has been lower than England’s baseline score since 2015. Since 2018, Southampton has followed the same trend as England and has made a steep increase. Southampton increased from 80.4 in 2018 to 87.5 in 2020.
More information is available in the resources section below.
Access to green space
Access to green space subdomain only looks at one indicator, private outdoor space. Southampton has a score of 89.1 for access to green space, the lowest and worst amongst England and local neighbours. This is over 1 standard deviation lower than England in 2015.
More information is available in the resources section below.
 Access to services
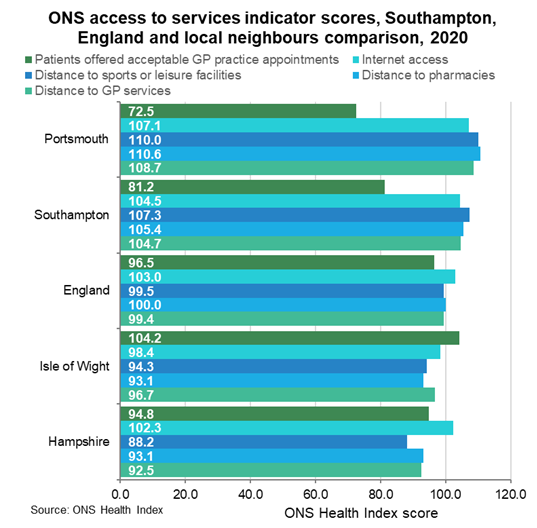
Access to services is Southampton’s highest domain score. With a score of 104.1, it is the 2nd highest compared to England and local neighbours (Portsmouth being the highest with 107.3) and 4.1 points higher than England (100.0). This is the second domain to have a higher score than England in 2015.
For distance to GP’s, pharmacies, sports or leisure facilities and internet access, Southampton has the 2nd highest and best score. However, for patients who were offered acceptable GP appointments, Southampton was the 2nd lowest and worst (81.2).
More information is available in the resources section below.
Crime
Southampton has a score of 89.4 for Crime in Southampton, the 2nd lowest and worst score, lower than England (102.5) in 2020 and just over 1 standard deviation lower than England in 2015. Crime score is made up of 2 indicators: personal crime and low-level crime. Southampton has the lowest and worst score for personal crime (85.5) compared to England and local neighbours, and the 2nd lowest and worst score for low-level crime (94.4).
More information is available in the resources section below.
Economic and working conditions
Southampton has the 2nd lowest score of 96.4 for economic and working conditions, lower than England (100.5) and lower than England in 2015. When looking at the indicator workplace safety, Southampton has the highest and best score of 111.2, just over 1 deviation higher than England in 2015. Southampton also has a score higher than 100 for job-related training (101.9) however has the lowest and worst score for child poverty (93.5).
More information is available in the resources section below.
Living conditions
Southampton has the 2nd lowest and worst score of 92.4 for living conditions, lower than England 2020, 104.9. Portsmouth has the lowest with 89.8 whilst Isle of Wight has the highest score of 108.9. Southampton has the lowest and worst score for household overcrowding, 89.4, and noise complaints, 89.4, both just over 1 deviation lower than England 2015. However, for air pollution, Southampton has a score of 107.3, higher than England in 2015.
More information is available in the resources section below.
Resources
ONS Health Index (Southampton) summary slides
Summary slides and main slide set for Southampton from the ONS Health Index.
ONS Health Index summary slides
pdf | 1.5 MB | 17.05.2023
ONS Health Index (Southampton) slides
Southampton from the ONS Health Index main report
ONS Health Index (2015-2020) slide set
pdf | 2.6 MB | 17.05.2023
Hampshire and Isle of Wight - ONS Health Index: 2015-2021
The Hampshire and Isle of Wight Joint Strategic Needs Assessment (JSNA) is aligned with the structure of the Office for National Statistics (ONS) Health Index. The power bi also includes an introduction to the Global Burden of Disease.
Hampshire’s ONS Health Index PowerBI
Visualisation
IHME - Global Burden of Disease (GBD)
The Global Burden of Disease (GBD) study provides a picture of mortality and disability across countries, time, age and sex. It quantifies health loss from hundreds of diseases, injuries, and risk factors.
IHME - Global Burden of Disease
Visualisation
ONS - Health Index contents and definitions
The Health Index for England, produced by the Office for National Statistics, which measures the health of the nation; definitions of the indicators used.
ONS - Health Index contents and definitions
Report
ONS - Health Index methods and development: 2015 to 2021
The Health Index measures health outcomes and risk factors over time, for different geographic areas. This methodology explains how we have constructed this tool.
ONS - Health Index methods and development: 2015 to 2021
Report
Last updated: 13 September 2023