Crime
 Total crime
Police recorded crime figures include notifiable offences that have been reported to and recorded by the police. Therefore, police recorded crime does not capture all crimes that occur, with some types of crimes more likely to be underreported than others.
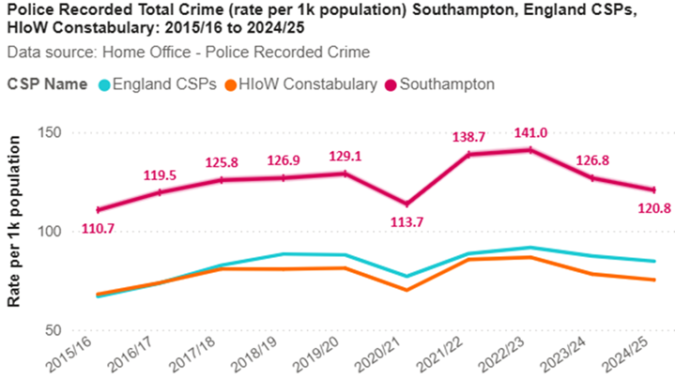 There were 31,332 police recorded crimes in Southampton during 2024/25, which is a decrease of -4.0% (-1,303 crimes) compared to the previous year (2023/24). This decrease was slightly greater than the -2.9% decrease recorded across Hampshire and Isle of Wight Constabulary and the -1.8% decrease seen nationally over the same period.
However, it is important to note that changes in the volume of crimes vary across different crime groups. As police recorded crime only includes crimes that have been reported to and recorded by the police, ‘hidden’ crimes such as domestic abuse are far more likely to be underreported than other offences such as theft.
The counting rule changes introduced in June 2023 remain in effect and may still influence some categories, particularly violent crimes, domestic crimes, stalking and harassment and public order offences. As these changes were introduced in the previous reporting period, their impact on overall crime trends was greatest in 2023/24; but may still have an impact in 2024/25. It should also be highlighted that in addition to changes in counting rules, police recorded crime can be influenced by improved awareness of key issues and improvements in recording by the police.
A crime prioritisation scoring exercise highlighted the following crime groups as a priority for the Partnership:
- Sexual offences, including other sexual offences and rape
- Domestic offences, including domestic violence
- Violent crime (all forms), including VAWG
Sexual offences, violent crimes and domestic offences have consistently featured among the top priority areas for the last seven years.
Community Safety Dashboard
Visualisation
 Crime distribution within the city
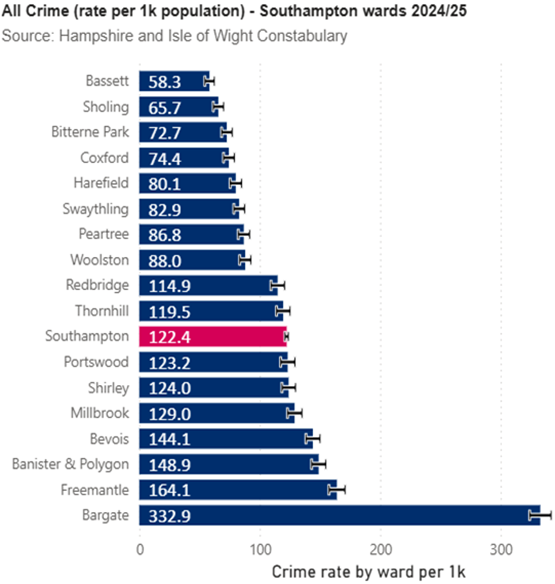
Studies have consistently found strong links between risk factors such as poverty and crime. Poverty alone does not cause criminal behaviour or victimisation but generates material and social conditions that mean that people living in poorer neighbourhoods are generally more likely to be the victims and/or the perpetrators of crime. Therefore, as poverty and other risk factors vary across the city, so will the frequency and relative severity of crime.
The crime rate in Southampton varies considerably by ward. Bargate ward had the highest rate of crimes per resident population in 2024/25. Bargate ward covers the city centre, which is where a large proportion of the day and night-time economy is in Southampton, which are associated with certain crime types, such as alcohol affected crime. Bassett ward had the lowest rate of offences, this ward is one of the more affluent areas of the city.
More information can be found in the deprivation and poverty page.
Community Safety Dashboard
Visualisation
What do residents say?
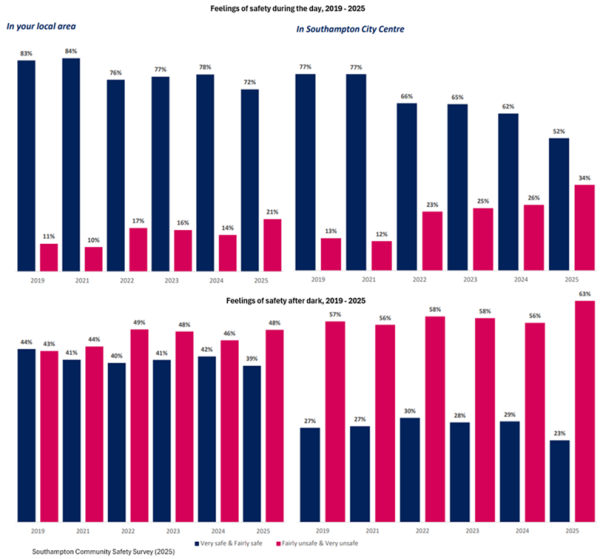 Feelings of safety in the community are important, as residents should be able to go about their daily activities without fear of crime or harm. The 2025 Southampton community safety survey was carried out by Southampton City Council from the 19th of August 2025 to the 15th of September 2025 to elicit the views of people living, studying and working in the city on community safety issues.
The majority of people who responded to the survey in 2025 felt crime had increased in the last 12 months (59%), with just 3% of respondents feeling it had declined. Over a third (38%) of respondents reported being a victim of crime or anti-social behaviour in Southampton during the last 12 months. Just 15% of respondents to the 2025 survey agreed that the police and other local public services were successfully dealing with crime and anti-social behaviour in their local area.
Survey respondents were asked about feelings of safety in their local area and the city centre. The majority of respondents in the 2025 survey felt safe during the day in their local area (72% felt safe) and in the city centre (52% felt safe). Respondents felt less safe after dark, particularly in the city centre; 39% of respondents felt safe after dark in their local area compared to 23% feeling safe after dark in the city centre. Feelings of safety after dark remain a substantial issue in Southampton, with females and respondents with disabilities feeling the most unsafe.
A summary report and slide set produced as part of the 2024/25 Strategic Assessment are available to download below. The interactive community safety dashboard can be accessed using the link below. For more information on crime in Southampton, see the Safe City Strategic Assessment page.
Community Safety Dashboard
Visualisation
Resources
2024/25 Safe City Strategic Assessment
The Southampton Safe City Strategic Assessment provides an overview of current and future crime, disorder and community safety issues affecting Southampton and makes recommendations to enable the Partnership to focus the Safe City Strategy and local delivery plans. The report and slide set that informed the assessment are available below to download. The interactive community safety dashboard can be accessed using the link below.
2024/25 Safe City Strategic Assessment report
2024/25 Safe City Strategic Assessment presentation
pdf | 5.7 MB | 12.12.2025
Community Safety Dashboard
Visualisation
Archived assessments
This section contains archived reports from previous Safe City Strategic Assessments. For the latest report and data on crime and community safety in the city, see the Safe City Strategic Assessment above.
2023/24 Safe City Strategic Assessment report
2022/23 Safe City Strategic Assessment report
2021/22 Safe City Strategic Assessment report
2020/21 Safe City Strategic Assessment
2019/20 Safe City Strategic Assessment
2018/19 Safe City Strategic Assessment
2017/18 Safe City Strategic Assessment
2016/17 Safe City Strategic Assessment
2015/16 Safe City Strategic Assessment
2014/15 Safe City Strategic Assessment
ONS - Crime in England and Wales
The Office for National Statistics (ONS) publish a quarterly report assessing crime in England and Wales using data from police recorded crime and the Telephone-operated Crime Survey for England and Wales. The report most relevant to the latest Southampton Safe City Strategic Assessment is linked below.
ONS – Crime in England and Wales: year ending March 2025
Website
data.police.uk
This site provides open street-level crime, outcome and stop-search datasets for police force areas across England, Wales and Northern Ireland.
data.police.uk
Website
Last updated: 05 January 2026