Housing and homelessness
 Housing in Southampton
Of the 108,518 dwellings in Southampton, 16,381 (15.1%) dwellings were owned by the Local Authority (Local Authority Housing Statistics, 2021/22). A further 7,901 (7.3%) dwellings were owned by housing associations in Southampton.
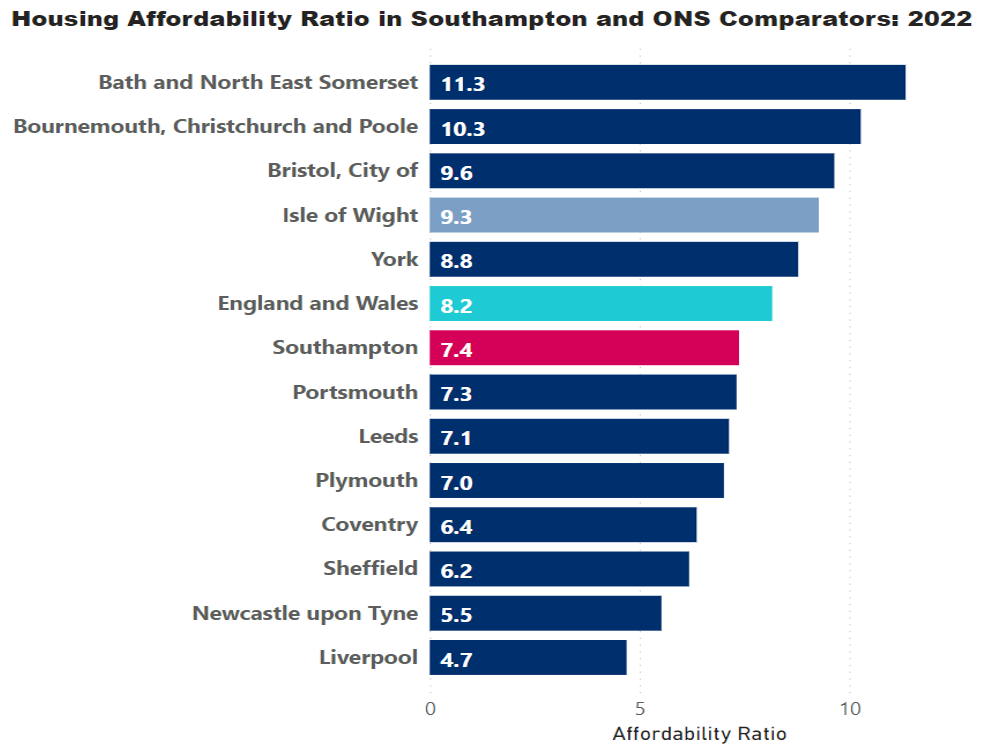 Affordability is measured by the Office of National Statistics through a ratio between the median house prices and median workplace earnings for the 12-month period ending in September of each year. In 2022, the ratio for Southampton was 7.4, suggesting that full-time employees in Southampton who wished to buy a home would have had to spend around 7.4 times their annual earnings to buy one (calculated for the past 12 months ending in September 2022). In 2022, the median price for a house in Southampton was £250,000.
48,838 (47.7%) of households owned their home in Southampton (23,049 owned outright and 25,789 with a mortgage or loan), whereas 29,860 (29.2%) rented their home privately. 22,397 (21.9%) lived in social rented homes, 1,061 (1%) lived in shared ownership homes and 134 (0.1%) lived rent free (Census 2021).
2021 Census data also shows that bedroom overcrowding is a concern for 5,952 (5.8%) households in Southampton. Of those that are overcrowded, most households require one more room (5,204, 5.1%) and 748 (0.7%) households require two or more rooms.
Housing and health
The quality of housing is crucial to health and well-being, especially for the vulnerable, young and old who can be particularly susceptible to poor health associated with inadequate heating and insulation, damp and overcrowding. Poor housing conditions can cause a range of physical and mental illnesses and children growing up in difficult housing conditions are more likely to suffer severe ill-health and disability during childhood/early adulthood.
 Living in overcrowded accommodation can, both directly and indirectly, have a devastating effect on families. Under-achievement at school can be caused by lack of space for children to do their homework. Absence rates may be higher because of illness associated at least in part with poor living conditions. Older children may spend more time outside the home, on the streets, simply to find privacy and space. Overcrowding may exacerbate stress, depression and in the worst cases domestic violence or breakdown of relationships (DCLG, 2007).
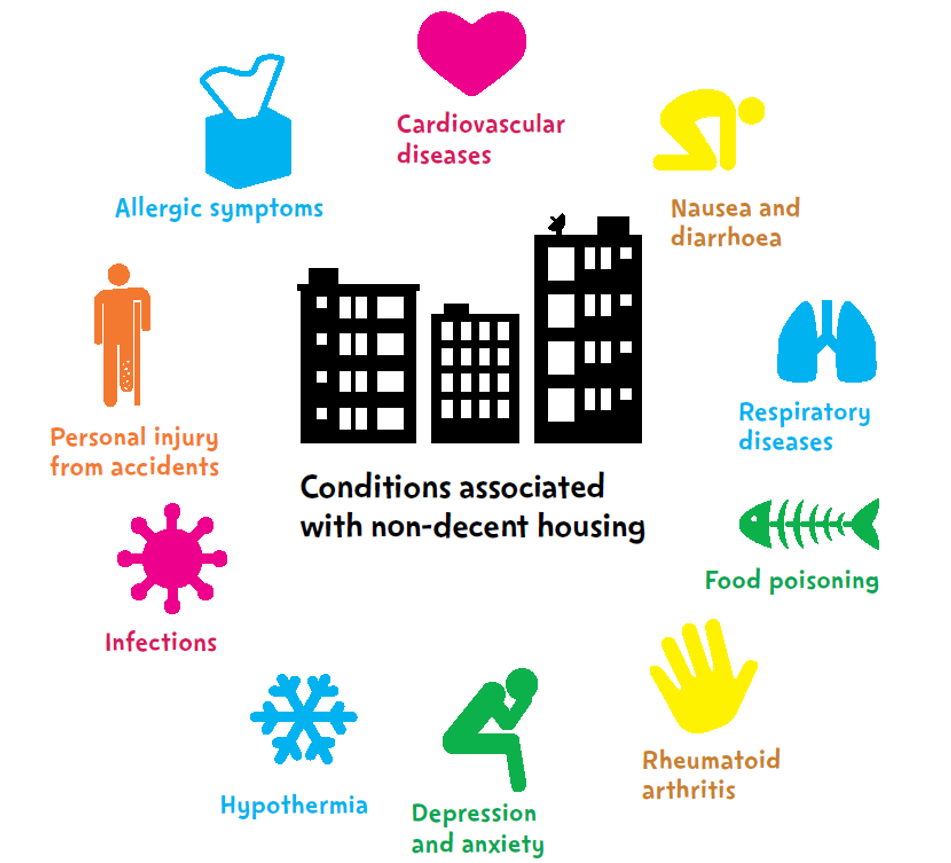
Poor housing conditions are estimated to cost the NHS at least £1.4 billion per year (Nicol et al, 2010). The conditions associated with poor housing are summarised in the image below, but the strongest links are with accidents (of which 45% occur in the home) and cold. There are broader aspects of housing that affect health such as overcrowding, sleep deprivation, community safety and features of the local infrastructure including proximity to parks and shops selling affordable, healthy food.
Health inequalities are often intrinsically linked to housing. In particular, the Marmot Review 10 Year On, Health Equity in England: The Marmot Review 10 Years On - The Health Foundation, recommends improving the energy efficiency of housing across the social gradient. Strong evidence is presented on the health impact of improving energy efficiency and reducing fuel poverty, especially in private housing. Evidence shows that living in cold homes is associated with poor health outcomes and an increased risk of morbidity and mortality for all age groups; furthermore, studies have shown that more than one in five (21.5%) excess winter deaths in England and Wales are attributable to the coldest quarter of housing (Institute of Health Equity, 2011).
A household is considered to be fuel poor if they have required fuel costs that are above average (the national median level) and, were they to spend that amount, they would be left with a residual income below the official poverty line. Fuel poverty is distinct from general poverty: not all poor households are fuel poor, and some households would not normally be considered poor but could be pushed into fuel poverty if they have high energy costs.
In 2022, 13.4% of households in England (3.26 million households) were estimated to be living in fuel poverty, slightly increasing from 13.1% (3.16 million) in 2021, according to the Annual Fuel Poverty Statistics 2023 (2022 & 2021 data). The proportion living in fuel poverty in Southampton in 2021 was slightly lower, amounting to 10.4% (10,902 households) in the city. Moreover, according to Census 2021, 2.2% of the households in Southampton had no central heating, while only 1.5% were in the same situation nationally. For further information on fuel poverty, see the deprivation and poverty page.
Homelessness
Statutory homelessness statistics for the 2021/22 financial year reveal that in Southampton 5.3 households per 1k were assessed as being threatened by homelessness and 10.4 households per 1k were assessed as being homeless.
Based on Autumn count data, the number of people rough sleeping on a single night in Southampton was three times higher in 2022 (27 people) compared to 2021 (9 people). Looking at trends over time, the average count between 2010 and 2022 was 20 people a year, with the 2022 count (27 people) above this average.
In addition, there are believed to be high numbers of ‘hidden homeless’ people who are housed by family and friends in shifting circumstances, but not always captured as part of the official figures. Underpinning these upward trends are the various causes of homelessness, of which, the most important remains the supply and affordability of decent housing.
Local authorities have a long-standing responsibility to help households who are at risk of homelessness or threatened by homelessness. Under the Homelessness Act 2022, local authorities have a statutory duty to develop a strategic plan to tackle homelessness based on a review of homelessness in the area.
Southampton’s Strategic Assessment on Housing and Homelessness 2023 provides a detailed review of homelessness in Southampton. This Strategic Assessment determines the extent to which the population is homeless or at risk of homelessness. This full needs assessment and data associated with homelessness in Southampton can be downloaded from the resources section below.
Resources
Homelessness Prevention Needs Assessment and Strategy
Homelessness Prevention needs assessments are developed to better understand homelessness in Southampton and determine the extent to which the population in the district is homeless or at risk of becoming homeless. Needs assessments can then be used to inform prevention strategies. Needs assessments and data associated with homelessness in Southampton can be downloaded below, along with the local and national strategies. A link for the Southampton Homelessness Prevention Strategy 2024-2029 will be added below when available.
Southampton Homelessness Needs Assessment 2023
Southampton Homelessness Prevention Review 2018
Southampton Homelessness Prevention data compendium 2018
Southampton Homelessness Prevention Strategy 2018-2023
MHCLG - Rough Sleeping Strategy August 2018
Report
Housing and homelessness data
More benchmarking and trend over time data on housing and homelessness in Southampton can be accessed using the links below.
ONS - Housing affordability in England and Wales: 2022
Report
Land Registry - UK House Price Index
Visualisation
Census 2021
Website
Census 2021 dashboard
Visualisation
Southampton Economic Assessment
Website
Economic dashboard
Visualisation
Fuel poverty statistics
Dataset
Homelessness statistics
Dataset
Last updated: 23 October 2023