
Ethnicity, language and identity
 Proficiency in English and languages spoken
Southampton is a diverse city with nearly 160 languages spoken in the city.
The 2021 Census looked at people’s ability to speak English, known as proficiency in English. In Southampton, 203,603 (84.6%) of residents have English as their main language and 37,044 (15.4%) of residents do not have English as their main language.
 Of these 37,044 people, 83.4% speak English well or very well. 14.6% (5,398 people) cannot speak English well and 2.1% (761 people) cannot speak English at all. In Southampton, this is an increase of 17.7% from 4,587, in 2011 to 5,398 in 2021, who cannot speak English well. There was also an increase of 6.1% (44 people) in the number of people who cannot speak English. Nationally 17.1% cannot speak English well and 3.1% cannot speak English at all.
Among our ONS comparators, Liverpool is the highest with 20.7% of residents that cannot speak English well, an increase of 90.2% between 2011 and 2021. The lowest is Bath and North East Somerset with 8.5%, an increase of 10.1%. Among our local neighbours the Isle of Wight saw a slight fall of -0.3%.
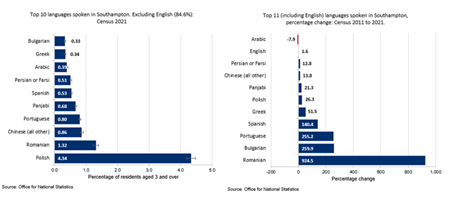
The top 10 first languages spoken in Southampton, according to the 2021 Census, excluding English (84.6%) are Polish, Romanian, Chinese, Portuguese, Spanish, Persian or Farsi, Arabic, Greek and Bulgarian. Polish speakers make up 4.34% of the population an increase of 26.3% between the 2011 and 2021 Census. Although Romanian speakers make up only 1.32%, they have increased by 924.5% between the two Census.
 In 2023, in Southampton, 31.1% of school pupils had a first language other than English, higher than the England average of 20.2%.
In Southampton, data from the Spring 2023 school census looking at first languages spoken by pupils shows that English is ranked 1 in all wards. The ward with the highest percentage for English is Thornhill ward at 87.4% of pupils, followed by Sholing ward (87.0%), the lowest ward is Bevios ward has only 28.0% of pupils with English as a first language.
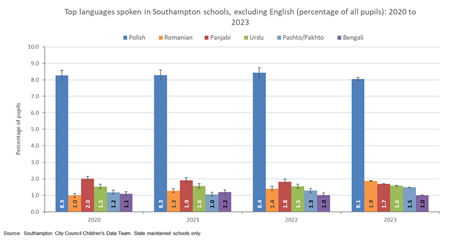
Polish is ranked second highest in Southampton with 8.1% (2,626) of all pupils. Among Southampton wards, Polish is the second highest language spoken in all wards, apart from in Bevios where Urdu is the second highest language spoken with 12.4% of pupils.
In Southampton as a whole Romanian is the third highest at 1.9% (609) pupils, an increase of 288 pupils or 89.7% since 2020. Among wards Romanian is also third highest in Bassett (2.6%), Freemantle (3.9%), Thornhill (0.8%) and Woolston (1.0%).
More information on languages spoken by pupils in Southampton schools can be found in the data compendium below, including information by ward.
Also available in the resources section at the end of this page is the 2021 Census the interactive Power BI dashboard. The dashboard allows users to benchmark Southampton data with ONS comparator areas as well as mapping data at various geographical levels.
Ethnicity
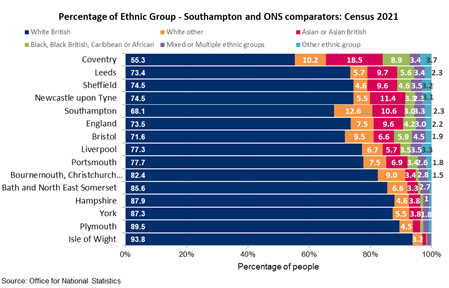 Results from the 2021 Census, recorded over 2,090 different ethnic groups nationally. In Southampton, 68.1% of usual residents are white British, a decrease of -7.9% since Census 2011. Compared with a decrease of -1.7% in England. Meaning that the population of Southampton is getting more culturally diverse.
In Southampton, 31.9% of residents consider themselves other than white British, compared with 22.3% in 2011. An increase of 50.2% or just over 26,537 people.
Amongst our ONS comparators, Coventry has the lowest percent (55.3%) of residents who are white British and Plymouth the highest at 89.5%. Among our local neighbours, the Isle of Wight has the highest at 93.8%. Coventry has the largest Asian or British Asian ethnic group (18.5%) compared with 10.6% in Southampton, 9.6% in England, Plymouth (2.2%) and for our local neighbours; only 1.2% in the Isle of Wight. Looking in more detail, in Southampton, 4.0% of residents are Polish, 3.7% are Indian or British Indian and 1.7% are Chinese.
Within Southampton, there is a wide variation in ethnic diversity. In Bevois ward, the largest ethnic group is white British at 36.1% followed by Asian or British Asian (29.1%) and 18.2% of the population are white other (than white British). In Freemantle, the largest ethnic group is white British (56.1%) followed by white other (than white British) (21.5%). Sholing has the largest white British ethnic group (87.3%).
Looking in more detail at the changes in ethnicity across Southampton wards, there has been a fall in the white British population across all wards except Woolston (an increase of 1.4%), ranging from a fall of -0.9% in Redbridge to a fall of -16.0% in Portswood.
In Southampton wards, the largest changes in the number of people by ethnic groups, between Census 2011 and Census 2021, show an increase in Bargate of 2,154 white (other than white British), 1,491 Asian or British Asian (including 582 Chinese) and 621 Black, Black British, Caribbean or African people. The wards with higher percentages of ethnic groups above the city average remain the same as were recorded for the 2011 Census (Bevois, Bargate, Freemantle, Swaythling, Portswood, Bassett and Shirley).
In terms of percentage point change, Bargate has seen the largest increases among ethnic groups showing Bargate’s diversity has increased the most of electoral wards since the previous Census.
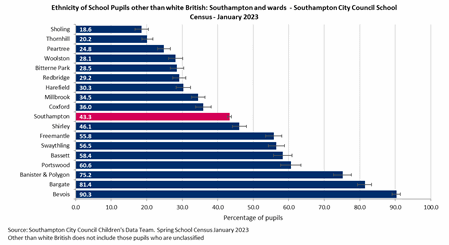 In the spring 2023 school census of pupils, 42.9% of pupils were from an ethnic group other than white British. This has increased from 33.5% in 2015, a 9.4 percentage point increase.
In Southampton in 2022, 41% of live births were born to mothers who were born outside the UK. Of the live births in Southampton, 19% were to mothers born in Europe, 14% to those born in the Middle East and Asia, 7% to mothers born in Africa and 2% were born in the rest of the world. Southampton has a higher proportion of live births born to non-UK-born mothers than its local neighbours, 32% in Portsmouth, 19% in Hampshire and 9% on the Isle of Wight, reflecting the diversity of Southampton’s community.
Looking at the ethnicity of school pupils, shows that in Southampton as a whole 56.2% of pupils are white British, rising to 82.6% of pupils who live in Thornhill ward and only 9.3% of pupils who live in Bevios ward.
More information on the ethnicity of pupils in Southampton schools can be found in the data companion below, including information by Southampton ward.
Also available in the resources section at the end of this page is the 2021 Census the interactive Power BI dashboard. The dashboard allows users to benchmark Southampton data with ONS comparator areas as well as mapping data at various geographical levels.
Religion
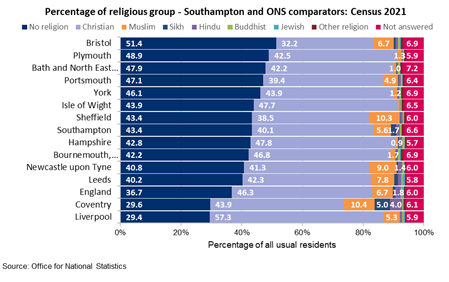 According to the 2021 Census, 43.4% of the population of Southampton, had no religion, compared with 36.7% in England. 40.1% of the population reported their religion to be Christian, compared to 46.3% in England. This is a fall of -18.1% from the 2011 Census.
The second largest religion in Southampton is Muslim. In 2021, 5.6% of Southampton’s population were Muslim, the third largest were Sikh at 1.7% of the population, Hindu at 1.3% and other religions make up 0.7% (1,664 people) of the population. Of other religions: Pagan’s are the largest group of 465 people or 0.2% of the population.
More information on religious groups in Southampton can be found in the slide set, data compendium available below and in the resources section at the end of the page.
National identity
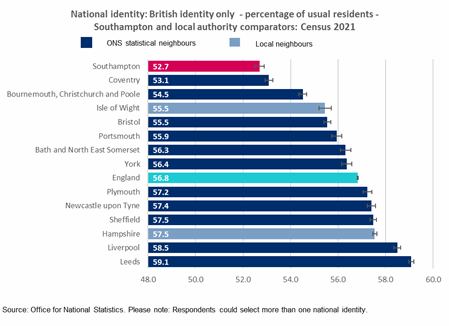 In the Census 2021, 52.7% of residents of Southampton, identified themselves as British, lowest amongst our comparators and the England average of 56.8%. The highest percentage among ONS comparators was Leeds at 59.1%.
In Southampton, 5.3% of residents identified themselves as of Non-UK identity only. Compared with 10.0% in England. Amongst our ONS comparators Coventry had the highest percentage at 18.2% and our local neighbour Isle of Wight had the lowest at 3.3%.
More information on national identity in Southampton can be found in the slide set, data compendium available below and in the resources section at the end of the page.
Sexual orientation and gender identity
For the first time Census 2021 included questions on sexual orientation and gender identity, for more information on these questions see the main Census 2021 page.
Resources
Census 2021 interactive dashboard
Users can access a range of Census data across different topic areas including population, education, identity, housing, health and work. With the ability to view benchmarking between Southampton and ONS comparators and mapping of data by Census geographies, such as lower layer super output areas (LSOA) a neighbourhood of around 1,500 residents.
Population dashboard
The dashboard presents a range of population data to provide intelligence on Southampton's resident and GP registered population to help drive strategic decision making. Data in this dashboard is compiled from a range of publicly available sources. Including Small Area Population Forecasts (SAPF), Mid-Year Population Estimates (MYE), Subnational Population Projections (SNPP) and GP Registered Populations. The compendium also contains information on languages spoken in schools and ethnic groups of school pupils.
Census 2021 - slide set and data compendium
Data releases from the 2021 Census, compared with 2011 Census and other population estimates. Results include population by age and sex, population density, migration and households. A summary slide set and a data compendium comparing Southampton, ONS comparators and England can be downloaded using the links below.
Ethnicity and language in Southampton schools - data compendium
Data from the Department for Education and Southampton City Council on ethnicity and languages spoken in schools
Population dashboard
The dashboard presents a range of population data to provide intelligence on Southampton's resident and GP registered population to help drive strategic decision making. Data in this dashboard is compiled from a range of publicly available sources. Including Small Area Population Forecasts (SAPF), Mid-Year Population Estimates (MYE), Subnational Population Projections (SNPP) and GP Registered Populations. Please note that SAPF figures in the dashboard are the sum of all Lower Level Super Output Areas (LSOA) and may not be the same as other published figures. It also contains information on ethnicity of school pupils and languages spoken in schools.
Department for Education – Schools, pupils and their characteristics
Information on the latest statistics on school and pupil numbers and their characteristics, including age, gender, free school meals (FSM) eligibility, English as an additional language, ethnicity, school characteristics, class sizes.
ONS data links
Data releases from the 2021 Census, from the Office for National Statistics (ONS).
Census 2021 - Nomis
Nomis is a service provided by Office for National Statistics (ONS), the UK’s largest independent producer of official statistics. These include data from current and previous censuses.
Tableau public - Census 2021 - maps by Jon Rumsey
Ethnicity hub - Why we no longer use the term ‘BAME’ in government?
Information from the Equality Hub and central government on what they are doing to remove the barriers to equality and help to build a fairer society. Information on why we no longer use the term BAME.
ONS - Create a population group profile
The Office for National statistics has produced a new tool that allows for customised population groups. Select one or more identity characteristics to define a population group, for example people whose main language is Spanish or people born in the UK who are disabled under the Equality Act. Once selected, you will see how your selected group compares to the whole population of England and Wales, based on Census 2021 data.
Last updated: 13 August 2024