Road safety
 Road Safety
Road traffic collisions (RTCs) are a major cause of preventable death and morbidity, particularly in younger age groups. A large proportion of road traffic collisions are preventable and can be avoided through improved education, awareness, road infrastructure and vehicle safety. All RTCs involving human death or personal injury occurring on a public highway and notified to the police within 30 days of occurrence are recorded using the STATS19 accident reporting form. 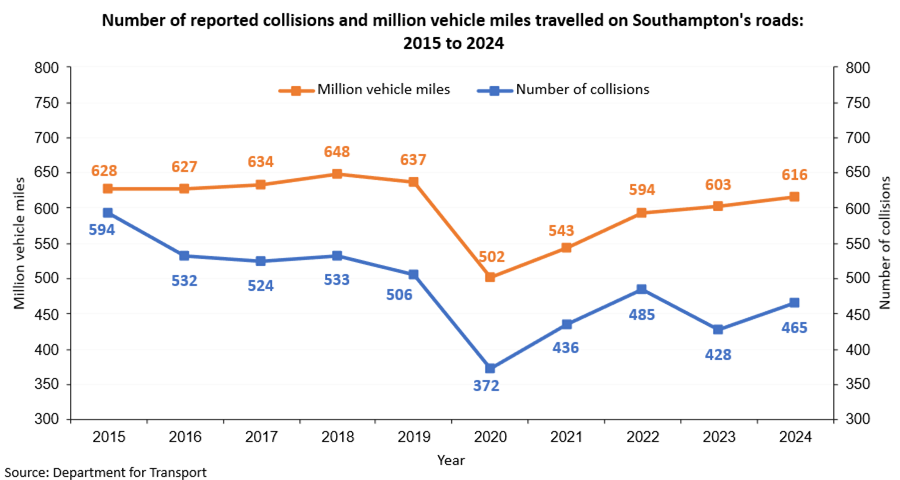 There is no obligation or legal reason to report all personal injury collisions to the police, although STATS19 data is the best measure of collisions and casualties available. Some collision types are more likely to be underreported than others, for example pedal cyclist collisions with pedestrians. It should be noted that road safety data is subject to revisions by the Department for Transport; therefore, trend data may differ than previously presented.
Data monitored by the Department for Transport show that traffic on major roads in Southampton has experienced an overall increase since 2020. A higher volume of traffic generally increases the likelihood of collisions. In Southampton, the number of reported road injury collisions has remained fairly stable over the last few years; 2022 (485 collisions), 2023 (428 collisions) and 2024 (465 collisions).
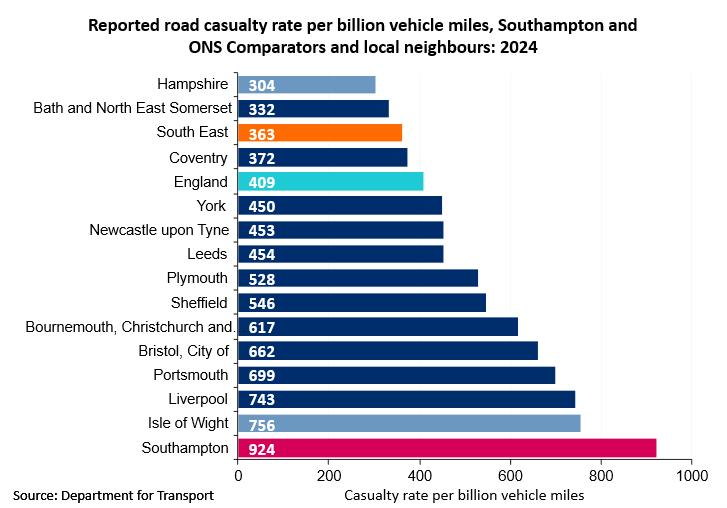 The reported road casualty rate per billion vehicle miles uses the total number of miles driven on the road network to adjust for differences in the amount of traffic. In 2024, Southampton experienced 924 casualties per billion vehicle miles travelled on its roads, an increase since 2023 (820). The road casualty rate in Southampton remains higher than the England rate (409) and is the highest among ONS comparators in 2024.
In 2024, 568 people were recorded as being injured in road collisions on Southampton roads, a +14.7% increase from 2023. There was one fatal casualty from collisions that occurred in 2024.
A summary report and slide set produced as part of the 2024/25 Strategic Assessment are available to download below. For more information on crime in Southampton, see the Safe City Strategic Assessment page. The interactive community safety dashboard can be accessed using the link below.
Community Safety Dashboard
Visualisation
Resources
2024/25 Safe City Strategic Assessment
The Southampton Safe City Strategic Assessment provides an overview of current and future crime, disorder and community safety issues affecting Southampton and makes recommendations to enable the Partnership to focus the Safe City Strategy and local delivery plans. The report and slide set that informed the assessment are available below to download. The interactive community safety dashboard can be accessed using the link below.
2024/25 Safe City Strategic Assessment report
2024/25 Safe City Strategic Assessment presentation
pdf | 5.7 MB | 12.12.2025
Community Safety Dashboard
Visualisation
Archived assessments
This section contains archived reports from previous Safe City Strategic Assessments. For the latest report and data on crime and community safety in the city, see the Safe City Strategic Assessment above.
2023/24 Safe City Strategic Assessment report
2022/23 Safe City Strategic Assessment report
2021/22 Safe City Strategic Assessment report
2020/21 Safe City Strategic Assessment
2019/20 Safe City Strategic Assessment
2018/19 Safe City Strategic Assessment
2017/18 Safe City Strategic Assessment
2016/17 Safe City Strategic Assessment
2015/16 Safe City Strategic Assessment
2014/15 Safe City Strategic Assessment
Department for Transport Dashboard
The Department for Transport (DfT) provide a publicly available dashboard that visualises the number of personal injury road traffic casualties in Great Britain that were reported by the police from 2018 using the STATS19 reporting system.
DfT - interactive road casualty dashboard
Visualisation
Last updated: 05 January 2026