Education outcomes
 Education outcomes
Southampton has a total of 75 schools and academies including 54 Primary Phase Schools, 12 Secondary, one All-through School, six Special Schools, one hospital school and one Pupil Referral Unit. In October 2025 just under 34,000 pupils are educated across Southampton schools. The outcomes reported below are for local authority maintained schools which includes maintained schools and academies but excludes independent schools, hospital schools, pupil referral units, alternative provision and electively home educated pupils.
Early Years Foundation Stage Profile
 The Early Years Foundation Stage Profile (EYFSP) is completed for pupils at the end of Reception. The EYFSP has seven Areas of Learning (three Prime Areas and four Specific Areas) and 17 Early Learning Goals. Pupils are teacher assessed as Emerging and Expected against each of the Early Learning Goals.
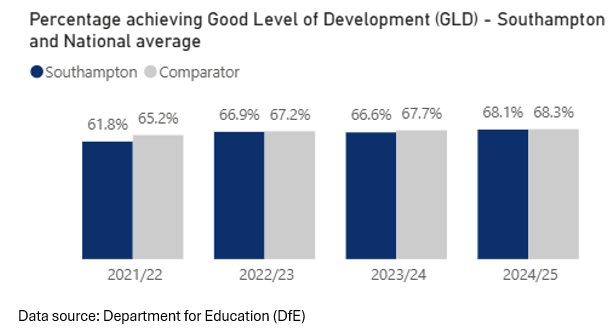
A pupil achieving the expected level in the Early Learning Goals (ELGs) within the three prime areas of learning (Communication and Language, Physical Development and Personal, Social and Emotional Development) and within Literacy and Mathematics is classed as having "a good level of development”. In 2025, 68.1% of pupils in Southampton achieved a Good Level of Development which was 0.2% below the England national average of 68.3%.
Phonics
 Pupils complete a Phonics screening check at the end of Year 1 where they achieve a score out of 40. A score of 32 or more is required for pupils to achieve the expected standard of Phonics decoding. Pupils who do not achieve a score of 32 or more at the end of Year 1 resit the check at the end of Year 2 along with any pupils who did not previously complete the check at the end of Year 1 (e.g. pupils new to the country).
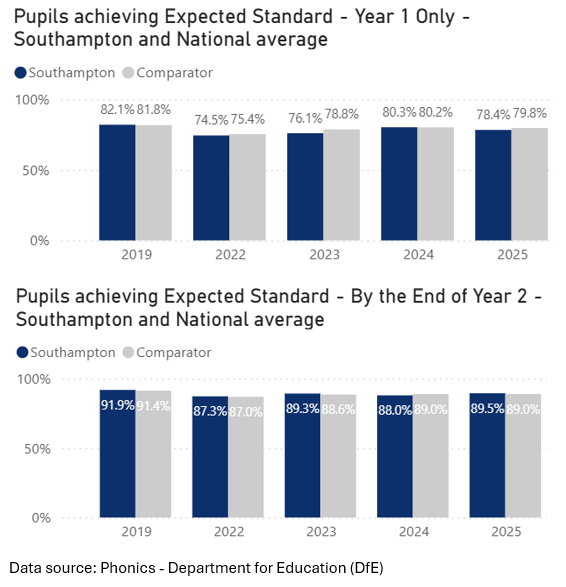
In 2025, 78.4% of Southampton’s Year 1 pupils achieved the expected standard in Phonics, which is 1.4% below the England national average of 79.8%, and 1.9% below the percentage of Year 1 Southampton pupils who achieved the expected standard in Phonics in 2024 (80.3%).
In 2025, 89.5% of Southampton’s pupils achieved the expected standard in Phonics by the end of Year 2, which is 0.5% above the England national average of 89.0%, and 1.5% above the percentage of Southampton pupils who achieved the expected standard in Phonics by the end of Year 2 in 2024 (88.0%).
Key Stage 2
 At the end of Year 6 pupils reach the end of Key Stage 2 (KS2) and are teacher assessed in Writing and tested in Reading and Maths. In each subject, pupils are awarded an outcome that identifies if they are working below the expected standard, working at the expected standard or working at a higher standard. The proportion of pupils that have achieved the expected standard across Reading, Writing and Maths combined is one of the main indicators at the end of KS2.
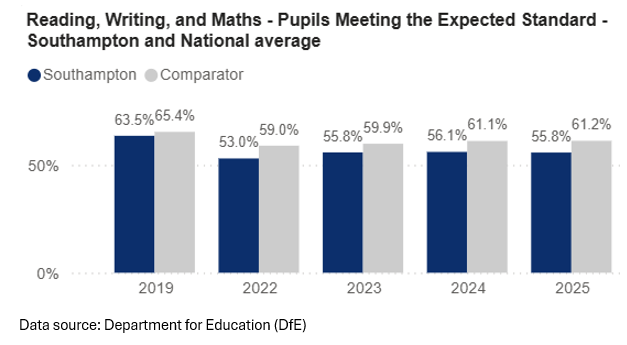
In 2025, 55.8% of Southampton pupils achieved the expected standard in Reading, Writing and Maths which was 5.4% below the England national performance of 61.2%. 6.7% of Southampton pupils achieved the higher standard in Reading, Writing and Maths; this is 1.6% below the England national average (8.3%) for this indicator.
Key Stage 2 progress measures are not available for the 2023/24 and 2024/25 academic years because the required Key Stage 1 (KS1) assessments were cancelled due to the COVID-19 pandemic. KS2 progress has therefore been removed from the analysis.
Key Stage 4
 At the end of Year 11 pupils reach the end of Key Stage 4 (KS4). The KS4 accountability of Attainment 8 and Progress 8 was introduced in 2016. In 2017, new, reformed English and Maths GCSEs were first examined and a new grading of 9-1 was introduced, with 9 being the highest grade.
In 2018, reformed English Baccalaureate GCSEs and a number of other key subjects were first examined using the 9-1 grading.
In 2019 further reformed GCSE qualifications were introduced on the 9-1 grade scale. For the first time in 2020 all GCSEs had been converted to a scale of 9-1 with no unreformed GCSEs graded A*-G remaining. Consequently, any trend comparisons made between 2016 and 2020 results for the key headline performance measures must be treated with caution.
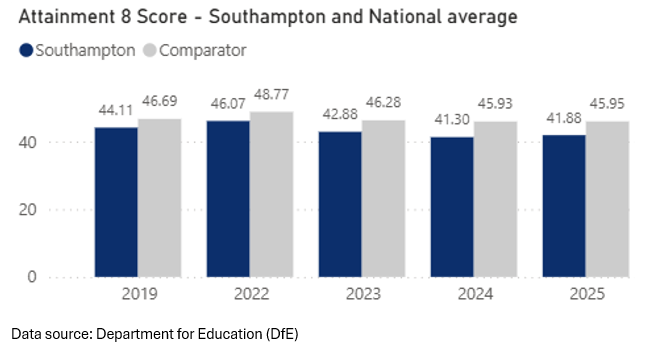
In 2025, Southampton pupils achieved an Attainment 8 score of 41.9, an increase of 0.6 on the Attainment 8 score for Southampton pupils in 2024 (41.3). The 2025 England national average for Attainment 8 was 46.0, a gap of 4.1 to the 2025 Southampton average (41.9).
14.6% of Southampton pupils achieved English Baccalaureate (EBacc) Grades 9-5 in 2025, which was 4.0% below the national average of 18.6%. In 2025, 36.4% of Southampton pupils entered the EBacc, a gap of 4.1% to the national average of 40.5%. Southampton’s EBacc Average Points Score in 2025 was 3.71, 0.37 below the England national average of 4.08.
There are no progress measures for the 2024/25 and 2025/26 academic years as Key Stage 4 pupils in these years did not have Key Stage 2 assessments due to the COVID-19 pandemic. KS4 progress has therefore been removed from the analysis.
Key Stage 5
 Students’ results are reported in Key Stage 5 (KS5) performance measures only once, at the point at which they have completed their 16 to 18 study (rather than reporting results as soon as they are achieved).
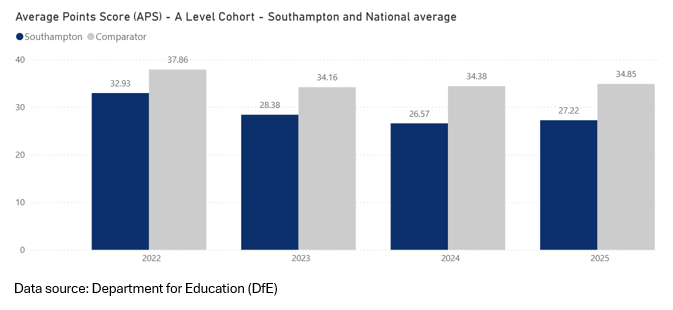
In 2025, Southampton’s Average Point Score per entry for all A-Level students was 27.2, compared to the England national average of 34.9; a gap of 7.6 points.
This is 5.7 points below the Statistical Neighbours average of 33.0 points, and 7.0 points below the Core Cities average of 34.2.
In 2025, Southampton’s percentage of students achieving grades AAB or better at A Level was 7.0%.
Absence
 Overall Absence measures the proportion of total possible school sessions that are recorded as an absence code. Absences from school can be authorised or unauthorised by the pupil’s school. In addition to the Overall Absence, a pupil is classed as Persistently Absent if they miss 10% or more of possible sessions. The proportion of pupil enrolments that have missed 10% or more of possible sessions is used to calculate the rate of persistently absent pupils.
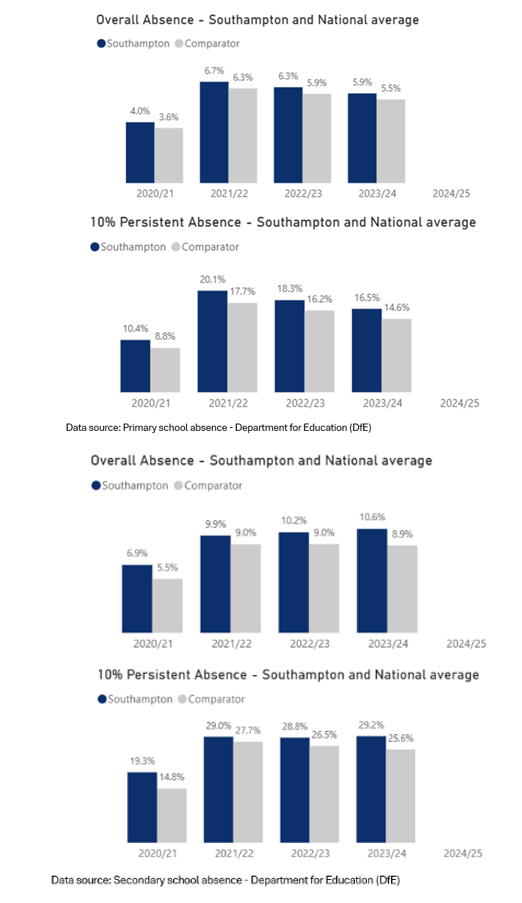
Southampton’s Overall Primary Absence for 2023/24 was 5.9%, which is 0.4% higher than the England national average (5.5%).
Southampton’s Primary School Persistent Absence for 2023/24 was 16.5%. Southampton’s performance of 16.5% was 1.9% above the England national average of 14.6%.
It is noted that the Primary absence and Primary 10% persistent absence figures have decreased year on year for both the England national average and for Southampton since 2021/22.
Southampton’s Secondary Persistent Absence for 2023/24 was 29.2%. Southampton’s performance of 29.2% was 3.6% above the England national average of 25.6%.
Southampton Secondary absence has increased year on year from 9.9% in 2021/22 to 10.6% in 2023/24, whereas the England national average has been relatively stable at around 9.0%.
The Southampton Secondary 10% persistent absence figures have been within 0.2% of 29.0% since 2021/22, but the Secondary England national average figures have decreased year on year from 27.7% in 2021/22 to 25.6% in 2023/24.
Permanent Exclusions and Suspensions
A Permanent Exclusion refers to a pupil who is excluded and who will not come back to that school (unless the exclusion is overturned). Suspensions, previously known as 'fixed period exclusions', refer to when a pupil is excluded from a school for a set period.
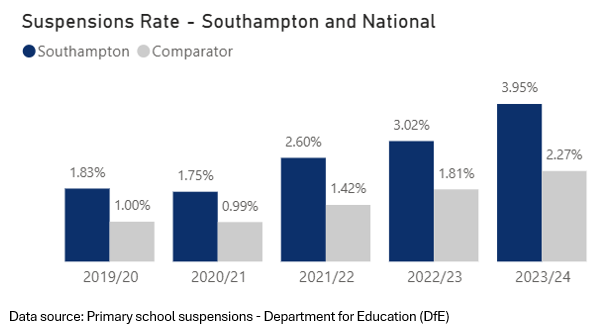 Southampton’s Primary schools had an exclusion rate of 0.05% for Permanent Exclusions in 2023/24. This was 0.02% higher than the England national average exclusion rate of 0.03%. Southampton’s Primary school Suspension rate was 3.95%, an increase of 0.93% from 3.02% in 2022/23. This was also 1.68% above the England national average (2.27%).
The Southampton Primary Suspension rate has increased year on year from 1.75% in 2020/21 to 3.95% in 2023/24. The England national Primary Suspension rate has also increased year on year over the same timeframe from 0.99% in 2020/21 to 2.27% in 2023/24.
 Southampton’s Secondary schools had a Permanent Exclusions rate of 0.18% during the academic year 2023/24. This is 0.07% lower than the rate of 0.25% in 2022/23. In 2023/24, Southampton’s performance (0.18%) was also 0.07% below the England national average (0.25%).
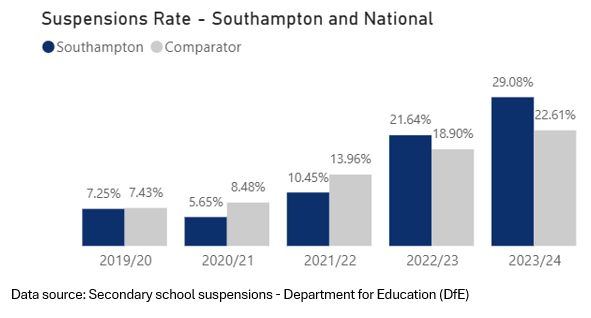
Southampton’s Secondary school suspension rate in 2023/24 was 29.08%, an increase of 7.44% from 21.64% in 2022/23. Southampton's performance (29.08%) was also 6.47% above the England national average (22.61%) for Secondary school suspensions.
The Southampton Secondary Suspension rate has increased year on year from 5.65% in 2020/21 to 29.08% in 2023/24. The England national Secondary Suspension rate has also increased year on year over the same timeframe from 8.48% in 2020/21 to 22.61% in 2023/24.
Resources section
Reference has been made to Statistical Neighbour and Core City performance in the Education Outcomes section. The Statistical Neighbour average consists of 10 Local Authorities (excluding Southampton) that are demographically similar to Southampton. Southampton’s Statistical Neighbours are currently Bolton, Coventry, Derby, Hillingdon, Leeds, Peterborough, Portsmouth, Salford, Sheffield and Waltham Forest. The Department for Education Statistical Neighbour benchmarking tool is available below. The Core City average consists of 8 Local Authorities (excluding Southampton) that are large regional cities. Local Authorities that make up the Core City average are Birmingham, Bristol, Leeds, Liverpool, Manchester, Newcastle, Nottingham and Sheffield.
Resources
Early years foundation stage profile
Statistics on early years foundation stage profile assessments including breakdowns by pupil characteristics.
DfE - Statistics: early years foundation stage profile
Dataset
Key stage 1 and phonics screening
Statistics on national curriculum assessments at key stage 1 and phonics screening check results.
DfE - Phonics screening check and key stage 1 assessment
Dataset
Key stage 2
National curriculum assessments and review outcomes at key stage 2, including measures of progress between key stages 1 and 2.
DfE - Key stage 2
Dataset
Key stage 4
Statistics on key stage 4 results, including GCSEs.
DfE - Statistics: GCSEs (key stage 4)
Dataset
Key stage 5
Statistics on the attainment of 16 to 19-year-olds in England, including exam results and performance tables.
DfE - Statistics: 16 to 19 attainment
Dataset
Absence
Statistics on overall authorised and unauthorised pupil absences by school type, including persistent absentees and pupil characteristics.
DfE - Absence
Dataset
Permanent exclusions and suspensions
Statistics on pupils who are excluded from school.
DfE - Permanent exclusions and suspensions
Dataset
Local Authority Interactive Tool (LAIT)
An interactive spreadsheet for comparing data about children and young people across all local authorities in England.
DfE - Local Authority Interactive Tool (LAIT) - Southampton
Dataset
Children's services statistical neighbour benchmarking tool
The Children’s services statistical neighbour benchmarking tool allows you to select a local authority and display its ‘closest statistical neighbours’ (local authorities with similar characteristics).
DfE - Children's services statistical neighbour benchmarking tool
Dataset
Last updated: 19 December 2025