Census 2021
Census overview
 The census is undertaken by the Office for National Statistics (ONS) every 10 years, since 1801, and gives a picture of all the people and households in England and Wales. The census asks questions about individuals, their household and their home. In doing so, it helps to build a detailed snapshot of society. Information from the census helps the government and local authorities to plan and fund local services, such as education, doctors’ surgeries and roads.
The latest Census took place 21 March 2021, and the first results were released on 28 June 2022. This page has been updated and changed as more information has been released.
The census is important to local authorities across England and Wales. It is also vital to the government and many other public sector organisations.
This is because it gives information to help:
- Develop policies
- Plan and run services, such as schools, health services, roads and libraries
- Decide how to allocate funds to make sure public funds get to where they are needed most
For example, census data showing how many people work in different jobs and industries are used to develop new job and training policies. Information on how people travel to work and how many cars they have contributes to planning roads and transport.
Also available are a set of interactive maps of the most recent data. The maps can be accessed directly from the 2021 Census Maps page from the Office for National Statistics, more details on the most recent releases are available below.
More data can be found in the interactive Power BI dashboard linked below. The dashboard allows users to benchmark Southampton data with ONS comparator areas as well as mapping data at various geographical levels. Further information, including a slide set and data compendium can be found in the resources section at the bottom of the page.
Census 2021 dashboard
Visualisation
Population size
 There were 59,597,542 people living in England and Wales (56,490,048 in England and 3,107,494 in Wales) on 21 March 2021, the day of the latest census. This is over 3.5 million more (6.3%) than in 2011 and is the largest census population ever recorded.
The English region with the largest population increase was the East of England, which grew by around 8.3% or 488,000 more residents. The English region with the smallest increase was the North East, growing by 1.9% or around 50,000 people. In Wales, the population grew by 1.4% or 44,000 people.
In Southampton, the population size has increased by 5.1%, from 236,882 in 2011 to 248,922 in 2021. This is lower than the overall increase for England (6.6%), where the population grew by nearly 3.5 million to 56,490,048 and lower than the South East (7.5%). In the city, the male population increased by 4.6% to 124,969 and the female population increased by 5.6% to 123,953.
Nearby areas like Test Valley and Eastleigh have seen a greater increase in their populations, by 12.1% and 9.0%, respectively, while others such as Fareham saw a smaller increase (2.6%) and New Forest saw a decrease of 0.4%. Looking at Southampton’s statistical comparators, the largest percentage change was recorded in Bristol which has increased by 10.3% from 428,234 in 2011 to 472,465 in 2021, an increase of 44,231 people. The smallest increase is in Sheffield where the population increased by 3,823 people or 0.7% to 556,521 in the 2021 Census.
The total population of local authority areas varies a lot, from Birmingham with around 1,144,900 people to the Isles of Scilly with around 2,100 people. In 2021, Southampton ranked 70th for total population size out of 309 local authority areas in England. This is the same position it held a decade ago in 2011.
More data can be found in the interactive Power BI dashboard linked below. The dashboard allows users to benchmark Southampton data with ONS comparator areas as well as mapping data at various geographical levels. Further information, including a slide set and data compendium can be found in the resources section at the bottom of the page.
Census 2021 dashboard
Visualisation
Population structure
 The population pyramid by age, shows Southampton continues to have a much younger population profile in comparison to England as a whole. Comparing against England, the biggest difference in the age structure of the population is in those aged 20 to 24. In Southampton they account for 10.5% of the total population compared to 6.0% for England.
Southampton has a lower percentage of those aged 50 to 54 (5.6%) and those people aged 70 to 74 (3.6%) when compared to England (6.9% for those people aged 50 to 54 and 5.0% for those aged 70 to 74 years).
The median population age in Southampton, in 2021, is 34 years compared to 32 years in the 2011 Census. In England it was 40 years of age, in 2021. More information on the size and structure of the population is available from the ONS.
Although the overall population has increased, there are variations by age group within the city:
- Southampton’s population aged under 5 years in 2021 is 13,795 (5.5%) compared to 15,407 (6.5%) in 2011. Overall, this is a decrease of -10.5% and is reflective of decreasing birth rates nationally and locally
- The population aged 5 to 14 has increased by 20.9% to 28,288 (11.4%) from 23,402 (9.9%) in 2011. The under 15 age group as a whole has increased by 8.4% in Southampton, which is greater than the increase recorded for England (5.0%)
- The population aged 15 to 24 has decreased to 42,892 (17.2%) in 2021 from 47,326 (20.0%) in 2011, a decrease of -9.4%. This is likely a reflection of reduced student residency in line with pandemic national and University policies at the time of the 2021 Census
- The number of people aged 65 to 84 has increased by 13.7% to 29,676, reflecting the ageing population. However, the very old, aged 85 and over has decreased by -2.0%, which may be influenced by higher levels of pandemic related deaths amongst older people
- Overall, the population aged over 65 in Southampton has increased by 11.3%, which is much lower than the increase recorded for England overall (20.1%)
An interactive chart from the ONS is available showing the age structure of the population in 2021 for local authorities in England and Wales. Select the area at the top to show the population structure for Southampton.
More data can be found in the interactive Power BI dashboard linked below. The dashboard allows users to benchmark Southampton data with ONS comparator areas as well as mapping data at various geographical levels. Further information, including a slide set and data compendium can be found in the resources section at the bottom of the page.
Census 2021 dashboard
Visualisation
Population density
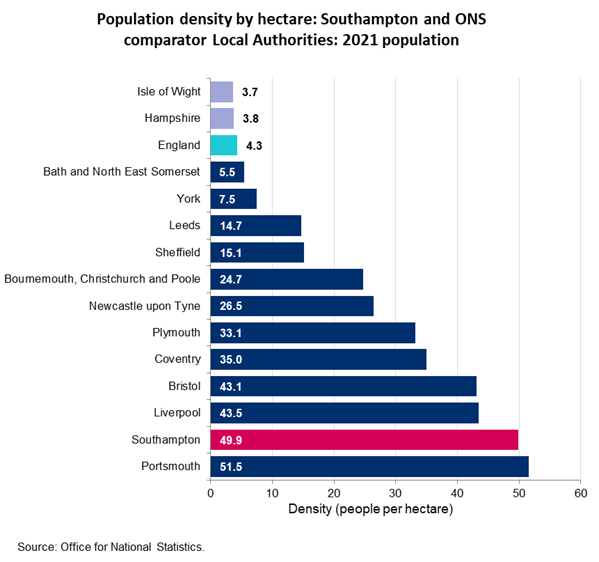 Population density in Southampton increased from 47.5 people per hectare in 2011 to 49.9 per hectare in the 2021 Census, a change in density of 2.4 people per hectare. This means Southampton is now more densely populated than in 2011.
Southampton has the 2nd highest population density among our ONS comparators and is the 2nd most densely populated area amongst the South East’s 64 local authorities, with around 36 people living on each football pitch-sized area of land. In comparison, Tower Hamlets in London has become the most densely populated local authority area in England (overtaking Islington) with the equivalent of around 112 people per pitch, whilst at the other end of the scale the amount of land in Eden in Cumbria works out at around five football pitches per resident!
Among our comparators Portsmouth is the most densely populated at 51.5 people per hectare (an increase of 0.8 people per hectare from 2011). The Isle of Wight is the least densely populated at 3.7 people per hectare (an increase of 0.1 people per hectare from 2011).
More data can be found in the interactive Power BI dashboard linked below. The dashboard allows users to benchmark Southampton data with ONS comparator areas as well as mapping data at various geographical levels. Further information, including a slide set and data compendium can be found in the resources section at the bottom of the page.
Census 2021 dashboard
Visualisation
Living arrangements
 In Southampton 52.3% of people aged 16 and over live in a couple and 47.7% are not living in a couple. This reflects the number of young people students (37,800) in Southampton. Lower when compared to England (57.8%) for those people living in a couple and higher than England (42.2%) for those not living in a couple.
Of the number of people living in a couple, 69.4% are either married or registered in a civil partnership, 30.4% are cohabiting and 0.2% are separated but still married or in a civil partnership.
In Southampton, of those not living in a couple, 68.5% are single (never married and never registered in a civil partnership), 3.2% are married or registered in a civil partnership but not living together, 4.0% are separated, 14.9% divorced and 9.4% widowed.
The range among Southampton wards shows that 61.0% (7,058) of people in Sholing are living in a couple compared with 39.0% (5,543) in Bevois again reflecting the large student population of the city, conversely 78.4% of people in Portswood are single never married and never registered in a civil partnership.
In Southampton the number of people living in a couple has increased by 7.5% since the 2011 Census. There has been an increase of 21.6% in cohabiting couples. The percentage of people who are single has increased by 1.7%. The percentage of people who are widowed has fallen by -14.7% between the 2011 and 2021 census.
More data can be found in the interactive Power BI dashboard linked below. The dashboard allows users to benchmark Southampton data with ONS comparator areas as well as mapping data at various geographical levels. Further information, including a slide set and data compendium can be found in the resources section at the bottom of the page.
Census 2021 dashboard
Visualisation
Households
 The number of households in Southampton with at least one resident increased from 98,254 in 2011 to 102,291 in Census 2021, an increase of 4.1%. This is lower than the overall England increase of 6.2% and is the 6th lowest change amongst our ONS comparators. Hampshire and Bath and North East Somerset saw the biggest increases in households (7.8%) between 2011 and 2021, whilst Liverpool (0.5%) and Portsmouth (0.8%) saw the smallest growth.
The number of one person households in Southampton has increased from 33,241 in 2011 to 33,711 in Census 2021 an increase of 1.4%. Older person single households increased by 1.5% between 2011 and 2021 (it should be noted that in 2011 census older people were classified as aged 65 and over. In the 2021 Census they are classified as 66 and over).
One family households increased from 53,070 in 2011 to 58,597 households in 2021 an increase of 10.4%. Lone parent families increased from 10,048 in 2011 to 11,270 in 2021 an increase of 12.2%.
The number of other household types including full time students fell from 11,943 in 2011 to 9,983 households in 2021 a decrease of -16.4%. This may be due to fewer student households in Southampton due to the COVID-19 pandemic restrictions.
More data can be found in the interactive Power BI dashboard linked below. The dashboard allows users to benchmark Southampton data with ONS comparator areas as well as mapping data at various geographical levels. Further information, including a slide set and data compendium can be found in the resources section at the bottom of the page.
Census 2021 dashboard
Visualisation
Car and van ownership
 In the 2021 Census people were asked the number of cars or vans owned or available for use by household members. Motorbikes, trikes, quad bikes or mobility scooters were not included in this question.
In Southampton, 27.4% households have no car or van available to households. Southampton is ranked 7th lowest among our comparators, the range being Liverpool with the highest (40.1%) and Bournemouth, the lowest (19.4%). Southampton is higher when compared with 23.5% of households in England having no cars or vans in households.
Locally, 72.6% of households own at least one or more car or van, lower when comparing Southampton to England (76.5%). Looking in more detail at those households that own one or more cars or vans:
- 44.3% own one car or van (higher when compared to 41.3% in England)
- 21.8% owning two cars or vans (lower when compared to 26.1% in England)
- 6.5% owning three or more cars or vans (lower when compared to 9.1% in England)
Looking more closely at ward level, 44.5% of households in Bevois and 44.2% of households in Bargate have no cars or vans, both among the most population dense urban areas in Southampton, with limited space for parking and good public transport links. For more information on population density see the population size and structure page.
More data can be found in the interactive Power BI dashboard linked below. The dashboard allows users to benchmark Southampton data with ONS comparator areas as well as mapping data at various geographical levels. Further information, including a slide set and data compendium can be found in the resources section at the bottom of the page.
Census 2021 dashboard
Visualisation
Language, ethnicity, religion and national identity
About 6 out of 7 people (aged 3+) in Southampton (84.6%) have English as their main language, lower than in the last Census (88.2%). There has been an increase of those who cannot speak English well (811 more people or +17.7%) and also those who cannot speak English (44 more people or +6.11%).
Southampton is getting more culturally diverse, 68.1% of usual residents are white British, a decrease of -7.9% since Census 2011. The wards that had higher percentage, in the last Census of ethnic population groups above the city average, are still reflect higher diversity as the 2021 Census. Bargate has seen the largest growth among those groups.
There have been changes in the religions that residents report belonging to compared to the previous Census. Among the city’s population; 43.4% report having no religion, an increase of 36.1%, 40.1% report to be Christian, a fall of -18.1% and the next largest group, Muslim (5.6%) has increased (+40.3%).
More information can be found on the Language, ethnicity, religion and national identity page and in the interactive Power BI dashboard linked below. The dashboard allows users to benchmark Southampton data with ONS comparator areas as well as mapping data at various geographical levels. Further information, including a slide set and data compendium can be found in the resources section at the bottom of the page.
Census 2021 dashboard
Visualisation
Veterans
New to the Census is data on National Identity and Veterans. The veterans data shows there are 6,361 UK veterans in the city (4,770 UK armed forces veterans, 1,346 UK reserve armed forces and 245 veterans serving in both).
More information and a deeper dive on veterans is available on the Veterans page.
More data can be found in the interactive Power BI dashboard linked below. The dashboard allows users to benchmark Southampton data with ONS comparator areas as well as mapping data at various geographical levels. Further information, including a slide set and data compendium can be found in the resources section at the bottom of the page.
Census 2021 dashboard
Visualisation
Schoolchildren and students
Data from the Census on schoolchildren and students includes any person aged 5 years and over in full-time education. Schoolchildren and students in full-time education studying away from home are treated as usually resident at their term-time address. In Southampton, 25.6% of people aged 5 and over are in full-time education. Higher when compared with England (20.4%). Southampton is the 3rd highest among our ONS comparators with Newcastle upon Tyne (29.1%) the highest and Bournemouth, Christchurch and Poole were the lowest at 19.7%.
More data can be found in the interactive Power BI dashboard linked below. The dashboard allows users to benchmark Southampton data with ONS comparator areas as well as mapping data at various geographical levels. Further information, including a slide set and data compendium can be found in the resources section at the bottom of the page.
Census 2021 dashboard
Visualisation
Sexual orientation
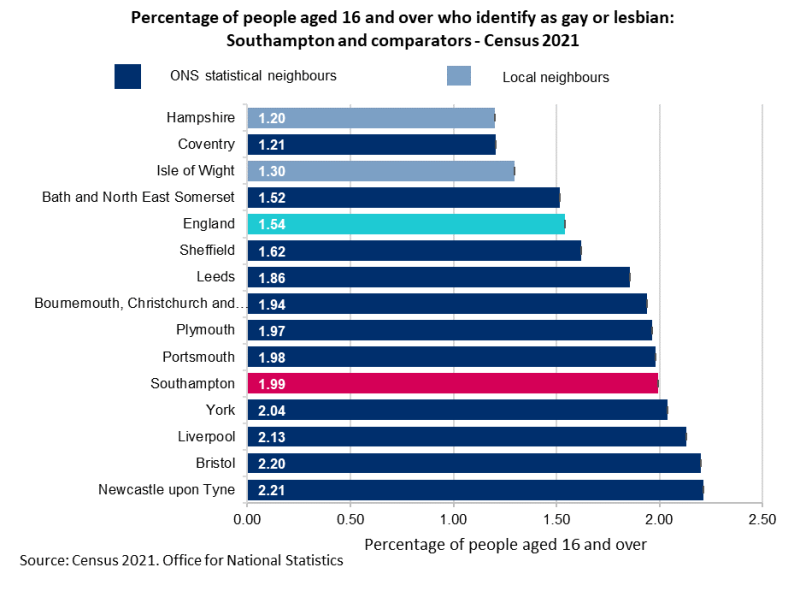 For the first time Census 2021 included a question on sexual orientation. Although voluntary, people aged 16 and over were asked to complete. In Southampton, 86.8% of people aged 16 and over considered themselves as Straight or Heterosexual, significantly lower than England (89.4%). Third lowest amongst our ONS comparators with Bristol the lowest at 85.5% and Plymouth is the highest at 88.9%.
In Southampton, there are 4,071 (2.0%) people who are gay or lesbian 5th highest amongst our ONS comparators and significantly higher when compared with 1.5% for England as a whole. There are also 4,830 people (2.4%) who are bisexual the 3rd highest amongst our ONS comparator group with Bristol as the highest (3.1%) and higher when compared to 1.3% in England. In Southampton, there are also 1,181 people (0.6%) who are other sexual orientations, including pansexual, asexual and queer. Third highest amongst ONS comparator and higher compared to 0.3% in England. In Southampton 8.3% of the people who filled in the Census didn’t answer this question, higher than England (7.5%).
More information on sexual orientation is available from the Office for National Statistics sexual orientation page. Please note that sex and age data is only available at country level currently and this page will be updated when it is available at local authority level.
More data can be found in the interactive Power BI dashboard linked below. The dashboard allows users to benchmark Southampton data with ONS comparator areas as well as mapping data at various geographical levels. Further information, including a slide set and data compendium can be found in the resources section at the bottom of the page.
Census 2021 dashboard
Visualisation
Gender identity
Results for gender identity estimates from the 2021 Census should not be used as precise estimates to support service delivery but can be used to provide insights. There are patterns in the gender identity estimates that suggest some respondents may not have interpreted the gender identity question as intended some people may have unintentionally given an answer that they had a gender identity different from their sex registered at birth this has increased uncertainty in the gender identity estimates.
More information is available on the ONS website Census 2021 - Gender identity estimates for England and Wales, additional guidance on uncertainty and appropriate use.
 For the first time the Census 2021 included a question on gender identity, which asked people aged over 16 what their gender identity was. In Southampton, 92.3% of the over 16 population identified as the same sex as registered at birth, the 2nd lowest amongst our ONS comparators and significantly lower when compared to 93.5% for England. Coventry is the lowest at 91.6% and Plymouth is the highest at 94.2%.
In Southampton, 1,633 people (0.80%) aged 16 and over identified themselves as a different sex from that registered at birth. This is significantly higher when compared to 0.55% for England. Southampton is ranked 3rd highest amongst our ONS Comparators, the largest being Newcastle upon Tyne (0.87%).
In Southampton, 0.15% of people were trans women, the highest ranking amongst our ONS comparators and higher when compared to 0.10% England. The same percentage (0.15%) were trans men and is ranking 1st amongst ONS comparators. There were 390 people (0.19%) with other gender identities in Southampton.
It is worth noting that as this question was voluntary, in Southampton, 6.9% of people aged 16 and over did not answer the question higher than England (6.0%).
More information on gender identity is available from the Office for National Statistics gender identity page. Please note that sex and age data is only available at country level currently and this page will be updated when it is available at local authority level.
More data can be found in the interactive Power BI dashboard linked below. The dashboard allows users to benchmark Southampton data with ONS comparator areas as well as mapping data at various geographical levels. Further information, including a slide set and data compendium can be found in the resources section at the bottom of the page.
Census 2021 dashboard
Visualisation
Disability
 In the Census 2021, the Office for National Statistics (disability section) asked the question "Do you have any physical or mental health conditions or illnesses lasting or expected to last 12 months or more?". If they answered yes, a further question "Do any of your conditions or illnesses reduce your ability to carry out day-to-day activities?" was asked. The question changed in order to collect data that more closely aligned with the definition of disability in the Equality Act (2010). The Equality Act defines an individual as disabled if they have a physical or mental impairment that has a substantial and long-term negative effect on their ability to carry out normal day-to-day activities. The way the ONS identified disabled people has therefore changed between 2011 and 2021 and this may have had an impact on the number of people identified as disabled.
In Southampton, 17.7% of all usual residents are disabled under the Equality Act, significantly higher than England (17.3%). Southampton is ranked 6th highest among our ONS comparators, with Liverpool the highest at 21.8% and Bath and North East Somerset the lowest at 16.4%.
In Southampton, 6.9% of residents are not disabled under the Equality Act but have a long term physical or mental health condition that doesn’t impact on day-to-day activities.
For the first time the Census 2021 created age standardised proportions (ASP) for disability that allow for comparison between populations over time and across geographies, as they account for differences in the population size and age structure.
Using this methodology, 8.2 APS of Southampton residents are disabled under the Equality Act and day-today activities are limited a lot, higher when compared with England (7.5 ASP). While 11.3 APS have their day to day activities limited a little, higher than England (10.2 ASP).
More data can be found in the interactive Power BI dashboard linked below. The dashboard allows users to benchmark Southampton data with ONS comparator areas as well as mapping data at various geographical levels. Further information, including a slide set and data compendium can be found in the resources section at the bottom of the page.
Resources
Census 2021 interactive dashboard
Users can access a range of Census data across different topic areas including population, education, identity, housing, health and work. With the ability to view benchmarking between Southampton and ONS comparators and mapping of data by Census geographies, such as lower layer super output areas (LSOA) a neighbourhood of around 1,500 residents.
Census 2021 dashboard
Visualisation
Census 2021 - slide set and data compendium
Data releases from the 2021 Census, compared with 2011 Census and other population estimates. Results include population by age and sex, population density, migration and households. A summary slide set and a data compendium comparing Southampton, ONS comparators and England can be downloaded using the links below.
Census 2021 results
pdf | 1.6 MB | 30.05.2023
Census 2021 data compendium
ONS data links
Data releases from the 2021 Census, from the Office for National Statistics (ONS).
ONS - Census 2021
Dataset
ONS - Create a custom dataset
Dataset
ONS - Census 2021 dictionary
Report
ONS - How does home ownership, health and more differ across society?
Report
ONS - Household and resident characteristics, England and Wales: Census 2021
Report
ONS - Ethnic group, national identity, language, and religion: Census 2021 in England and Wales
Report
ONS - International migration, England and Wales: Census 2021
Report
ONS - Census 2021 - gender identity
Report
ONS - Census 2021 - sexual orientation
Report
ONS - Census 2021 - disability
Report
ONS - How the population changed where you live: Southampton 2021 Census
Visualisation
ONS - Census 2021 maps - Southampton
Visualisation
ONS - How your area has changed in 10 years: Census 2021
Report
ONS - Play the Census 2021 quiz: how well do you know your area?
Visualisation
ONS - Play the Census 2021 population map game
Visualisation
First results from Census 2021 in England and Wales
Report
Tableau public - Census 2021 - maps by Jon Rumsey
Maps created from Census 2021 single variable data.
Tableau public - Census 2021 - England and Wales at Ward Level by Jon Rumsey
Visualisation
Tableau public - Census 2021 - England and Wales at MSOA Level by Jon Rumsey
Visualisation
Tableau public - HIOW LSOA Metrics - maps by Jon Rumsey
Visualisation
Census 2021 - Nomis
Nomis is a service provided by Office for National Statistics (ONS), the UK’s largest independent producer of official statistics. These include data from current and previous censuses.
Nomis - 2021 Census results
Dataset
ONS - Create a population group profile
The Office for National statistics has produced a new tool that allows for customised population groups. Select one or more identity characteristics to define a population group, for example people whose main language is Spanish or people born in the UK who are disabled under the Equality Act. Once selected, you will see how your selected group compares to the whole population of England and Wales, based on Census 2021 data.
ONS - Create a population group profile
Dataset
Build a custom profile
Create your own profile for local areas in England and Wales using Census 2021 data. Start with your postcode or select an area and built a profile of an area.
ONS - Build a custom area profile - Census 2021
Visualisation
ONS - Census 2021 gender identity estimates for England and Wales, additional guidance on uncertainty and appropriate use
There are patterns in the gender identity estimates from Census 2021 that suggest some respondents may not have interpreted the gender identity question as intended, most notably those with lower levels of English language proficiency. Gender identity estimates from Census 2021 should not be used as precise estimates to support service delivery, but can be used to provide insights; users should refer to the specific advice in this article before using the Census 2021 gender identity estimates to come to conclusions about the trans population.
ONS - Census 2021 gender identity estimates for England and Wales, additional guidance on uncertainty and appropriate use
Website
Last updated: 14 July 2025