Southampton geographical profiles
Southampton geographical profiles
 The sub-city geographical analysis usually refers to Lower Layer Super Output Areas (LSOAs). LSOAs are the most frequently used census geography and have an average population of 1,500. As of the 2021 Census there are 152 LSOAs in Southampton, more information on census geographies is provided by the ONS.
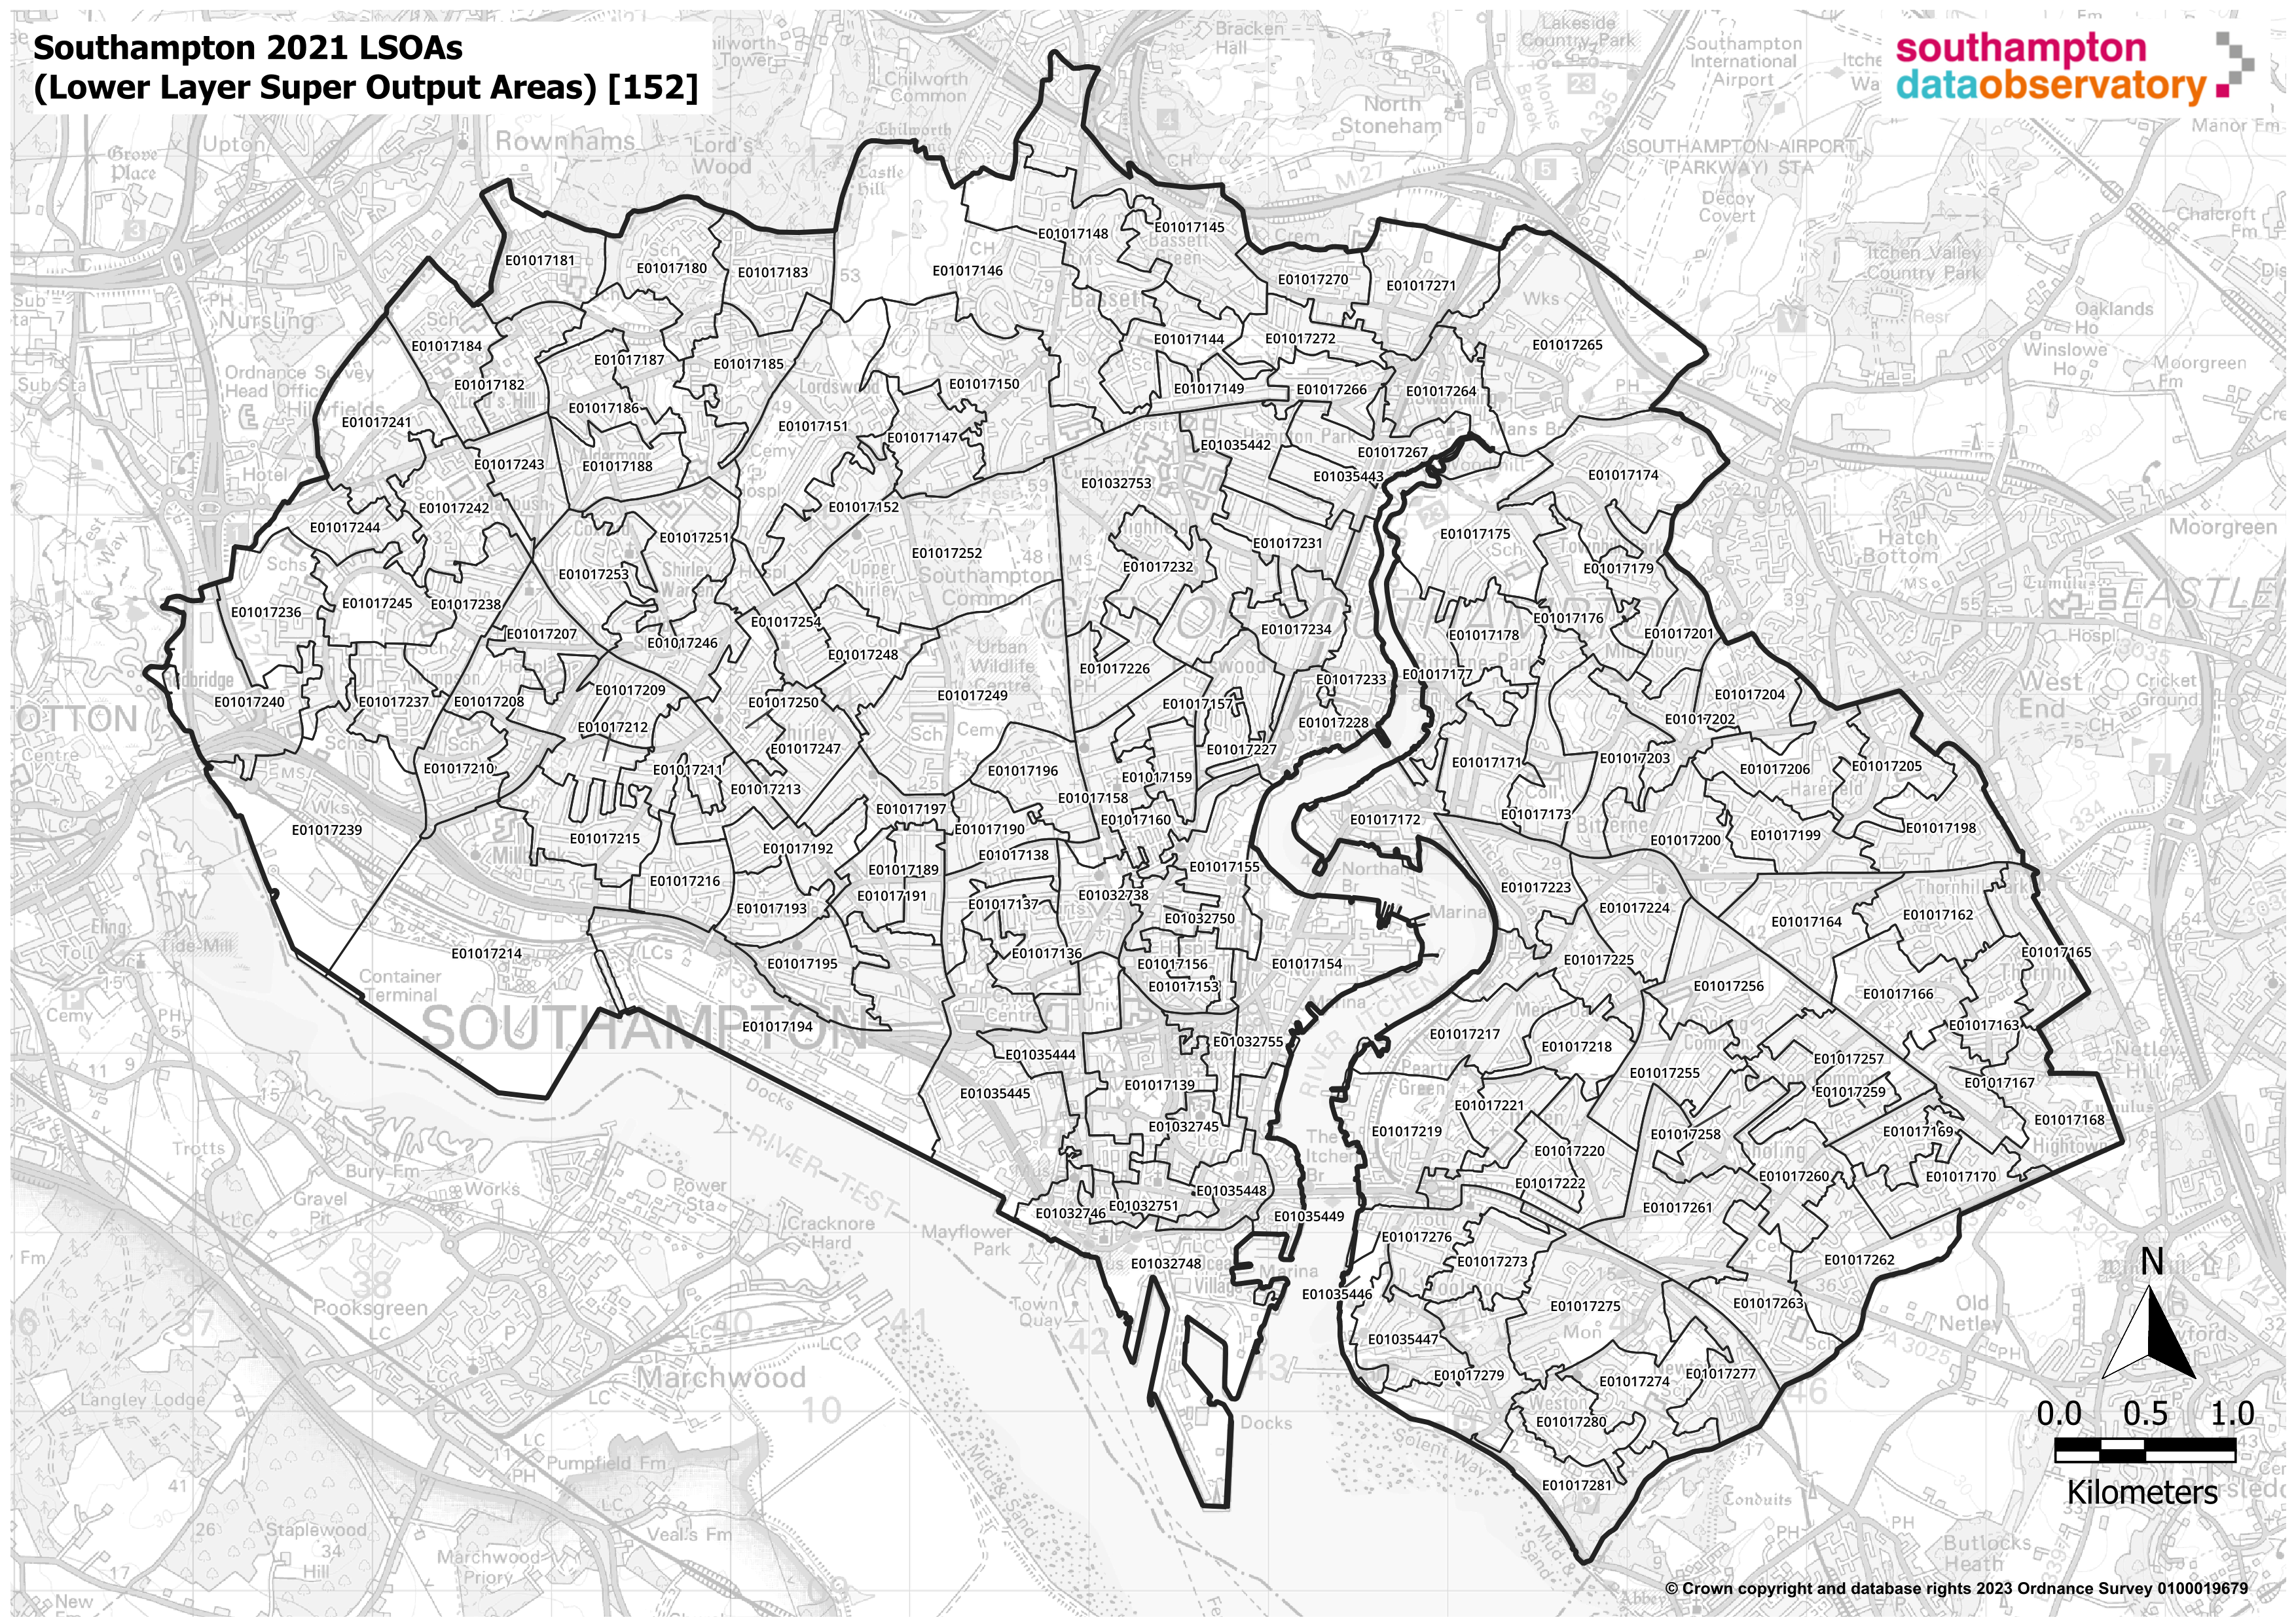 These profiles have been produced for all 152 LSOAs in Southampton, to meet the need for information and intelligence at the local level in the city and form part of the Single Needs Assessment for Southampton. These profiles pull together information across a range of topics to better understand the local population need at sub-city geographies.
The sub-city profiles are part of the interactive geographical profiles Power BI dashboard linked below. This dashboard provides data for a range of indicators grouped into various topics, including demography, economy, community safety, health, education and social care.
Geographical profiles dashboard
Visualisation
Resources
Geographical profiles dashboard
This dashboard provides profiles for neighbourhoods, electoral wards and localities in Southampton. These profiles have been produced to meet the need for information and intelligence at the local level in the city and form part of the Single Needs Assessment for Southampton. These profiles pull together information across a range of topics including demography, economy, community safety, health, education and social care to better understand the local population need at sub-city geographies.
Geographical profiles dashboard
Visualisation
Geographies dashboard
This dashboard draws together a selection of interactive maps on various topics all in one place. These maps range from geographical boundary maps and points of interest for Southampton.
Geographies dashboard
Visualisation
Census 2021 interactive dashboard
Users can access a range of Census data across different topic areas including population, education, identity, housing, health and work. With the ability to view benchmarking between Southampton and ONS comparators and mapping of data by Census geographies, such as lower layer super output areas (LSOA) a neighbourhood of around 1,500 residents.
Census 2021 dashboard
Visualisation
Southampton population dashboard
The dashboard presents a range of population data to provide intelligence on Southampton's resident and GP registered population to help drive strategic decision making. Data in this dashboard is compiled from a range of publicly available sources. Including Small Area Population Forecasts (SAPF), Mid-Year Population Estimates (MYE), Subnational Population Projections (SNPP) and GP Registered Populations. Please note that SAPF figures in the dashboard are the sum of all Lower Level Super Output Areas (LSOAs) and may not be the same as other published figures.
Southampton population dashboard
Visualisation
ONS - Subnational indicators explorer
Compare a local authority and the UK average (median) local authority by different indicators, such as weekly pay and healthy life expectancy.
ONS - Subnational indicators explorer
Visualisation
OCSI - Hyper-local Need measure
Developing a measure of Hyper-local Need: neighbourhood level data to inform Labour’s key missions. The ‘Hyper-local Need measure’ has been created to help demonstrate the ways in which complex social and economic challenges cluster in communities around the country.
OCSI - Hyper-local need measure
Website
OCSI - Local Insight: Hyper Local Needs Measure map
Visualisation
Last updated: 29 February 2024