
Energy and sustainability

 Energy and sustainability summary
Southampton is the fourth most densely populated city in England. Most environmental challenges and opportunities are due the city’s dense urban environment. The international container port, cruise terminal, airport, busy road (and rail) network and higher deprivation levels add to the complexity. Southampton has made progress through increased renewable energy generation, improved energy efficiency and heat network. There has been a steady reduction in greenhouse gas emissions and energy consumption (domestic and non-domestic) across the city over the last 20 years. Around 1 in 10 households are still fuel poor, the city has significantly higher greenhouse gas emissions (per km2) than the UK average and electric vehicle charging provision is below the national average. Southampton City Council's Green City Plan aims to address these issues through actions focused on sustainable energy, clean air and sustainable travel. These issues are all directly (or indirectly) linked to the health and wellbeing of our population.
Energy consumption
 In Southampton and across the UK, domestic energy consumption has been on a downward trend since the early 2000s. This reduction in energy use may be due to technological advancements in the energy efficiency of homes (and appliances), higher domestic energy bills (changing consumer behaviour) and/or warmer winters. This downward trend accelerated during the COVID-19 pandemic. Non-domestic energy use shows a similar reduction over time in Southampton and across the UK. Only 12 local authorities used more energy in 2024 than 2006, most of these areas have recently developed very high energy consuming industrial sites (like data centres). More information is available from the Subnational electricity and gas consumption summary report 2024.
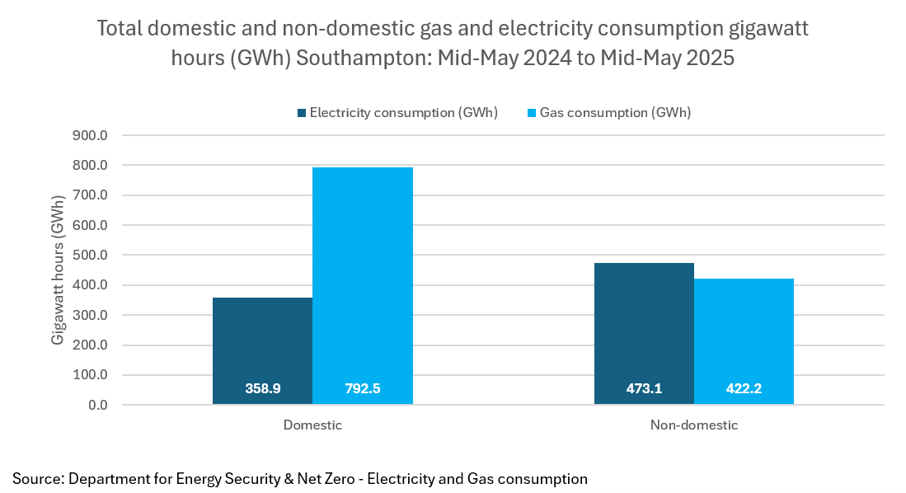
Energy consumption for the latest period, between mid-May 2024 and mid-May 2025, is broken down into Gas and Electricity for domestic and non-domestic settings.
 In Southampton, there are 80,580 domestic gas meters and 710 non-domestic gas meters. The annual consumption for gas is 792.5 gigawatts per hour (GWh) for domestic sources and 422.2 GWh for non-domestic sources. With a mean consumption of 9,835.5 kilowatts per meter for domestic gas sources and 594,680.1 kilowatts per meter for non-domestic gas sources. For electricity consumption, in the same period, for Southampton there are 108,622 domestic meters (94,261 standard meters and 14,361 Economy 7 meters) and 8,462 non-domestic meters. (Economy 7 is a time-of-use electricity tariff that provides a cheaper off-peak rate for seven hours at night and a higher rate during the day). The annual consumption for electricity is 358.9 GWh for domestic sources and 473.1 gigawatts per hours for non-domestic sources.
The domestic totals can be broken down into standard consumption of 283.0 GWh and 75.9 GWh for domestic Economy 7. With a mean consumption of 3,304.5 kilowatts per meter for domestic electricity sources and 55,911.3 kilowatts per meter for non-domestic electricity sources.
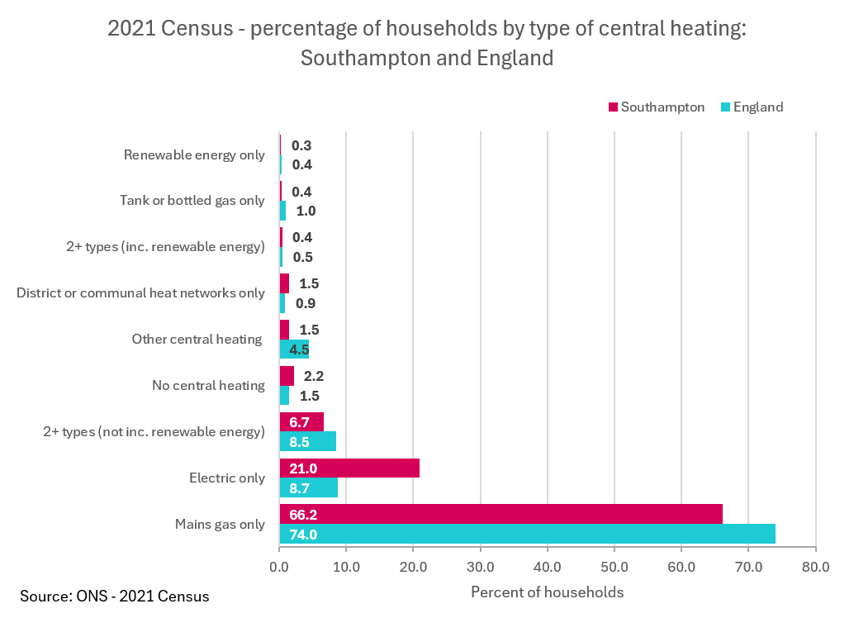
The 2021 Census recorded the number of households with and without central heating in Southampton. In the 2021 Census 2,214 households (2.2%) have no central heating, higher than the England average (1.5%). In Southampton 66.2% have mains gas, lower than the England average (74.0%). Southampton has 21,438 households (21.0%) with mains electricity, higher than the England average of 8.7%.
More information on the 2021 Census is available on the Census page.
Domestic buildings
 According to the 2025 Local Land Properties Gazetteer, domestic buildings make up just over 91% of the total number of buildings in Southampton.
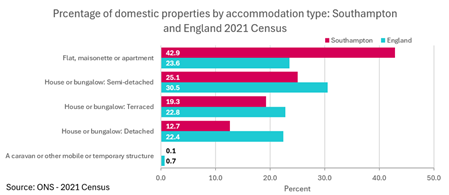
The 2021 Census recorded 46,450 flats, maisonettes or apartments in the city (42.9% of all homes). Significantly higher than the England average of 23.6%. This reflects the dense urban nature of Southampton and its relatively young population. There are 27,150 (25.1%) semi-detached properties, 20,885 (19.3%) terraced properties and 13,730 (12.7%) detached properties in Southampton. There are also 123 (0.1%) caravans or other temporary accommodation.
Energy efficiency (EPC)
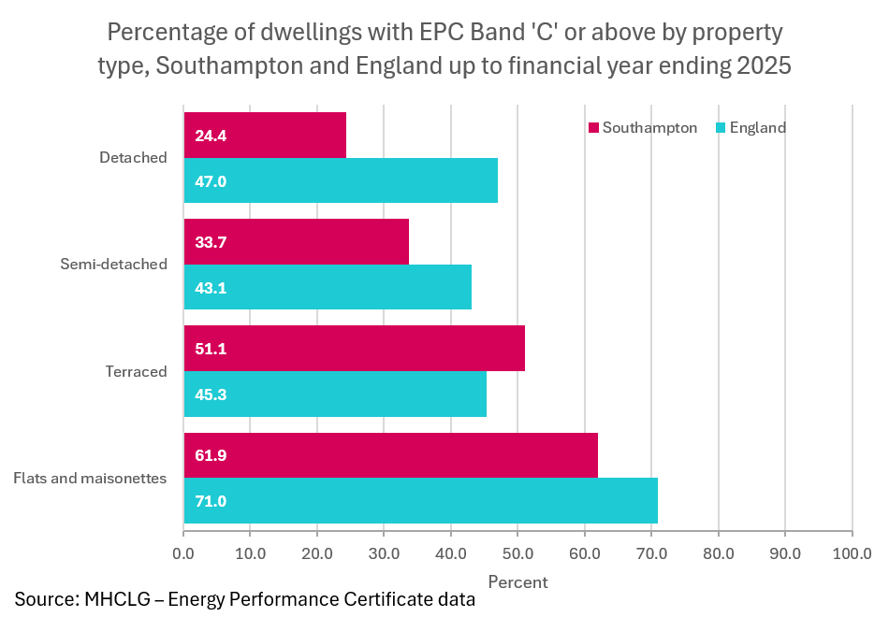 An Energy Performance Certificate (EPC) shows how energy efficient a property is, using a rating from A (most efficient) to G (least efficient). Energy efficient properties are deemed to be those with a current rating of C or better. More information is available on the Energy Saving Trust website.
EPCs are legally required when selling, renting or building a home and include recommendations to improve energy efficiency. Not every residential building has a current EPC rating as EPCs have only been mandatory since 2008 and not every property has been sold or rented since. Bungalows and houses come on the housing market less often and are less likely to have EPC certification. More information on EPC ratings and the methodology is available on the ONS website.
In 2025, the percent of dwellings in Southampton with an EPC rating of C or above was 52.9%, lower than the England average of 53.3%. More information on EPC ratings and analysis is available on the Energy efficiency (EPC) page.
Renewable energy sources
Southampton City Council has operated a heat network since 1986, connecting many of the large energy users, including the Civic Centre, West Quay Shopping Centre and Ikea. More information on heat networks is available on the Southampton City Council website.
Photovoltaic solar power
 Solar photovoltaic (PV) panels convert sunlight into electricity, when placed in suitable areas. As a city on England’s south coast, Southampton is well situated to generate solar energy. In 2025, there were 5,089 households in Southampton with photovoltaic solar panels (5.0% of all households). This is an increase of 9.8% since 2024 when there were 4,635 households with solar panels and an increase of 195.0% since 2014, when there were 1,725 households with solar panels. More information is available from the Department for Energy Security & Net Zero – renewable energy statistics.
In 2025, the 5,089 households with solar panels generated 18,779 megawatt hours of energy (amount of energy produced in one continuous hour) in Southampton.
The solar panels in Southampton have an installed capacity of 20.9 MW (megawatts), which is the maximum amount of electrical power a system can produce under ideal, bright sunlight conditions.
This compares to 18,851.6 MW installed capacity, in England in 2025. In total, renewable energy’s installed capacity is 40,975.9 MW. In England the next highest renewable energy sources are offshore wind (11,622.9 MW) and biomass and waste (5,720.6 MW).
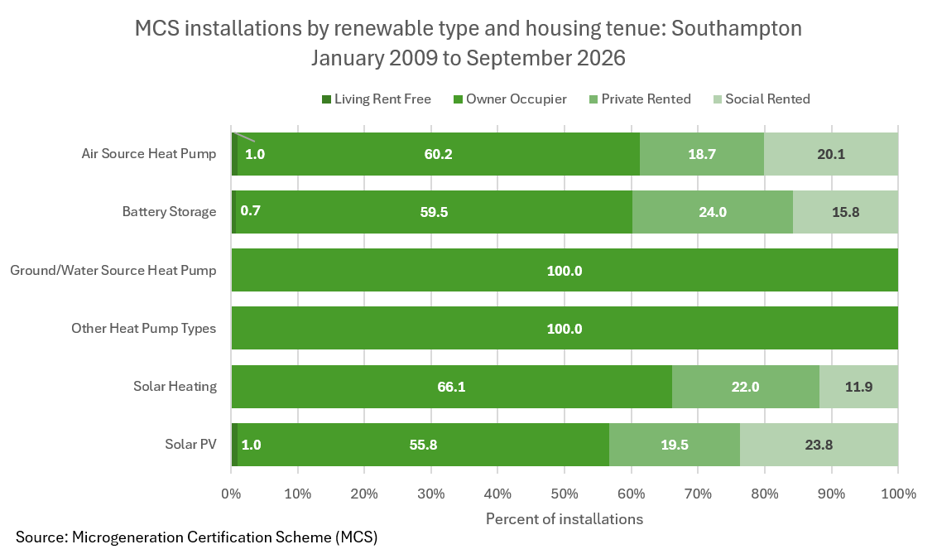
The Microgeneration Certification Scheme (MCS) is an industry-led scheme designed to support the development of smaller, decentralised energy generation (and to improve the quality and reliability of these installations). The scheme has been developed in partnership with Government.
In Southampton there have been 6,214 installations of MCS certified schemes, suggesting that around 6% of households have some form of installation. These installations include air source heat pumps, battery storage, Solar photovoltaic and solar heating. More information is available on the MCS dashboard.
Heat pumps
Heat pumps can be used as an alternative to fossil fuels. A heat pump is an energy efficient device that transfers heat from the outside air, ground, or water into a building to provide heating and hot water. There are two main types of heat pumps which are air source and ground source (and they both use electricity).
According to the Friends of the Earth website, 1,970 households in Southampton are using electric-powered heat pumps to heat their homes and hot water. Data from the Office for National Statistics suggests that less than 1% of dwellings in Southampton (around 900) have a heat pump (2025).
Fuel poverty
Nearly 1 in 10 households in Southampton were classified as fuel poor in 2024, this is around 10,700 households (9.8% of all households in the city). This is similar to the England average of 9.9%, (2.4 million households). This is based on the Low Income Low Energy Efficiency (LILEE) definition of fuel poverty. A household is deemed to be fuel poor if their Fuel Poverty Energy Efficiency Rating (FPEER) is D or below and if the household would be left with disposable income below the official poverty line after paying their energy bills. More information is available on the deprivation and poverty page.
Road traffic
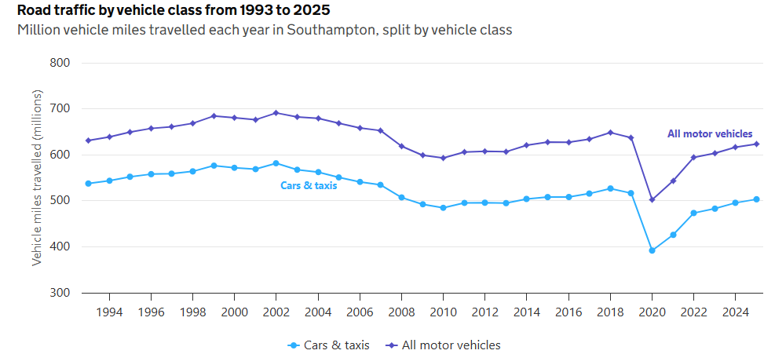 Road traffic is a major contributor to air pollution which can cause respiratory (and other) health issues. Data from the Department for Transport for Southampton shows that 623 million vehicle miles were travelled on Southampton roads in 2025.
The 2021 Census found that 27.4% of Southampton households have no car or van, higher than the England average (23.5%). This may be due to Southampton’s dense urban environment, good public transport links, higher deprivation or the city’s relatively young population (with two large universities). 44.3% have 1 car or van (slightly higher than the England average of 41.3%) and 28.4% have two or more cars and vans lower than the England average of 35.2%. Information on road safety is available on the road safety page.
Electric Vehicle (EV) charging
EVSE (electric vehicle supply equipment) is an independent part of a charging device which controls the charge session, enabling one electric vehicle (EV) to charge at a time.
As of 1 July 2026, in the United Kingdom, there were:
- 121,171 public EV chargers
- 174.9 public EV chargers per 100,000 of the population
- 28,887 public EV chargers that were rated rapid or above (50kW+)
- 41.7 public EV chargers rated rapid or above per 100,000 of the population
In July 2026, according to the Department for Transport and Zapmap (who coordinate EV charging point locations) there are currently 181 chargers in Southampton. As a rate this is 69.8 chargers per 100,000 people, less than half of the England average (172.7 chargers per 100,000 people).
The Department of Transport has suggested target figures for types of EV charging based on low (expected 5,000 EVs in Southampton in 2027), medium (7,000 EVs) and high (on track with UK average uptake to meet national expected demand) scenarios. This indicates that over 500 chargers of different types will be needed by 2027 to match the average UK demand for EV chargers.
Climate change
Southampton City Council published its Green City Charter and Plan in 2019. This identifies key priorities to create a cleaner, greener, healthier and more sustainable city.
Southampton’s Green City Plan sets out the council’s vision for a more sustainable council and how it will contribute to tackling some of the most challenging environmental issues in Southampton. It includes more than 60 specific actions which the city will undertake to deliver this, outlines the progress that has already been made and how ongoing progress will be measured. The council also commits to achieving net zero emissions in council commercial buildings by 2030, increasing the proportion of renewable energy generated and the proportion of zero and low emission vehicles used.
The Green City plan introduces five priority areas:
- Sustainable energy and carbon reduction
- Delivering clean air
- Our natural environment
- Resources, waste and water management
- Sustainable travel
More information on these priorities is available in the Green City Plan.
Air pollution
Air pollution is the presence of one or more contaminants in the atmosphere, such as dust, fumes, gas, mist, odour, smoke or vapour, in quantities and duration that can be harmful to human health.
Although there are many toxins that have adverse impacts on health, pollutants with the strongest evidence for public health concern include particulate matter (PM), carbon monoxide (CO), ozone (O3), nitrogen dioxide (NO2) and sulphur dioxide (SO2). Fine particulate matter is an especially important source of health risks, as these very small particles can penetrate deep into the lungs, enter the bloodstream, and travel to organs causing systemic damages to tissues and cells. More information from the World Health Organisation.
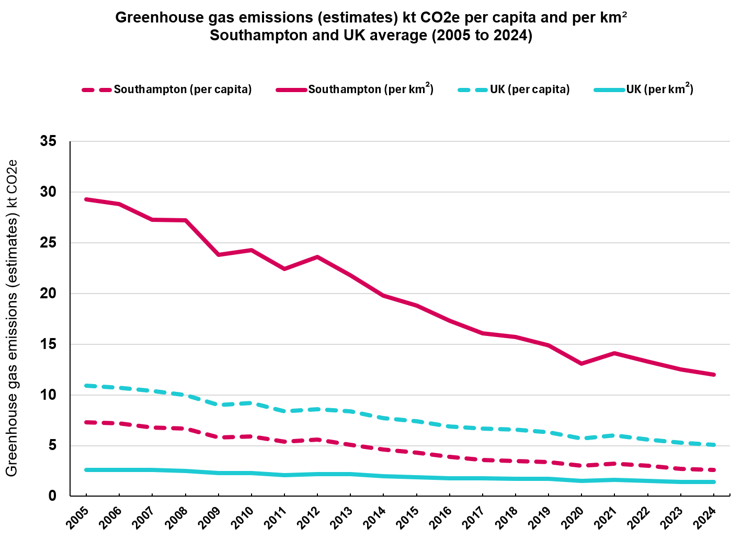 Looking at local authority emissions between 2023 and 2024, greenhouse gas emissions decreased in 71% (255) of the 361 local authority areas in the UK. This is consistent with the decrease seen in overall UK emissions in 2024. Most of the fall is the result of reduced emissions from electricity supply, reflective of higher net electricity imports, greater renewable generation and the closure of the UK’s last coal-fired power station in September 2024. More information is available from the Department of Energy Security & Net Zero.
In 2024, 32% of emissions assigned to local authority areas were attributed to the transport sector, 22% to the domestic sector, 14% to the industry sector, 14% to the agriculture sector, and 8% to the commercial sector. The remaining 10% of emissions were from the waste sector, the public sector, and other sectores described below.
Emissions estimates for local authority areas are categorised into the following broad source categories:
- Industry (including electricity and fuel supply related emissions)
- Commercial (including electricity and fuel supply related emissions)
- Public (including electricity and fuel supply related emissions)
- Domestic (including electricity and fuel supply related emissions)
- Transport
- Land use, land-use change, and forestry (LULUCF) tracking carbon emissions and removals resulting from direct human management of land and the atmosphere
- Agriculture (including electricity and fuel supply related emissions)
- Waste (distributed based on the waste arising in each local area)
Southampton has a high population density meaning emissions per person appear lower than the UK average because they are spread across a relatively large population, 2.6 tonnes of carbon dioxide equivalent (tCO2e) per capita and in the UK (5.1 tCO2e per capita).
Per capita emissions have steadily declined since 2005, in line with the UK trend. Comparisons with similar urban areas provide a more meaningful benchmark: among 16 comparator cities, Southampton has the second-lowest emissions per capita and ranks close to the average for emissions per km2. Emissions per km2 remain significantly above the UK average because they are concentrated within a small geographic area. 12.0 kt CO2e per km2, higher than in England (2.1 kt CO2e per km2).
More information on air pollution and greenhouse gas emissions is available in the resources section below.
Resources
Southampton City Coucil - Green City Plan
The Green City Plan 2030 sets a vision for a more sustainable council and how it will contribute to tackling some of the most challenging environmental issues in our city. It includes more than 60 specific actions which we will undertake to deliver this, outlines the progress that has already been made and how ongoing progress will be measured.
Southampton City Council - The Green City Plan 2030
Report
Southampton City Coucil - Sustainable energy
Information from Southampton City Council on reducing energy consumption, supporting the generation of sustainable energy and reducing carbon emissions to help tackle the climate emergency.
Southampton City Council - Sustainable energy
Website
Department for Energy Security & Net Zero - Energy Consumption in the UK (ECUK) 2025
Statistics on energy consumption used by people and businesses in their day-to-day activities
Department for Energy Security & Net Zero - Energy Consumption in the UK (ECUK) 2025
Report
Office for National Statistics - Energy efficiency of housing in England and Wales (EPC)
Energy efficiency, carbon dioxide emissions and central heating main fuel type for new and existing homes by property type, tenure, and property age.
Office for National Statistics - Energy efficiency of housing in England and Wales (EPC)
Report
Department for Energy Security and Net Zero – Regional renewable statistics
Information on renewable electricity data for local authorities and regions for England.
Department for Energy Security and Net Zero – Regional renewable statistics
Report
Planning Portal - The Microgeneration Certification Scheme (MCS)
The Microgeneration Certification Scheme is an industry-led scheme designed to support the development of the microgeneration industry and to drive the quality and reliability of installations. The scheme has been developed in partnership with Government, experts in the field and other organisations representing consumer interests.
Planning Portal - The Microgeneration Certification Scheme (MCS)
Website
The Microgeneration Certification Scheme (MCS)
Website
Department for Energy Security and Net Zero - Fuel poverty statistics
Fuel poverty in England is measured using the Low Income Low Energy Efficiency (LILEE) indicator. Under this indicator, a household is considered to be fuel poor if they are living in a property with a fuel poverty energy efficiency rating of band D or below and when they spend the required amount to heat their home, they are left with a residual income below the official poverty line
Department for Energy Security and Net Zero - Fuel poverty statistics
Dataset
Zapmap – Electric vehicle charging infrastructure data
Zapmap is the official data provider to the UK Government's Department for Transport for public EV charging infrastructure statistics.
Zapmap – Electric vehicle charging infrastructure data
Website
Department for Transport - Electric vehicle charging infrastructure statistics: data tables (EVCI)
Data about electric vehicle charging infrastructure.
Department for Transport - Electric vehicle charging infrastructure statistics: data tables (EVCI)
Dataset
Department for Energy Security and Net Zero - UK local authority and regional greenhouse gas emissions statistics, 2005 to 2024
UK local authority and regional estimates of greenhouse gas emissions.
Department for Energy Security and Net Zero - UK local authority and regional greenhouse gas emissions statistics, 2005 to 2024
Dataset
Last updated: 09 October 2026