
Waste

 Household waste
Southampton City Council is responsible for providing waste and recycling services. This includes the collection and disposal of residual, food, recycling, glass and green waste. Caution should be taken when comparing different areas because of external factors which can affect performance such as the population, housing types and the rural or urban classification.
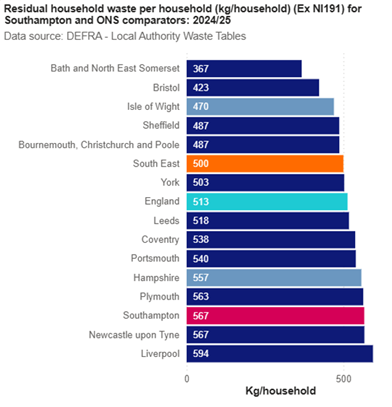
Residual waste per household (measured in kilograms) is calculated as the household waste not sent for recycling divided by the number of households within a local authority. A lower residual waste per household is desirable, with residual waste more costly to dispose of, not to mention the environmental impact of waste that is not recycled. In 2024/25, the Southampton residual household waste per household was 567kg, an increase from 564kg in 2023/24. Southampton continues to be ranked the third highest residual waste per household among ONS comparators.
The percentage of household waste sent for reuse, recycling or composting in Southampton remained broadly stable at 29.2% in 2024/25 compared to 29.6% in 2023/24. The Southampton household recycling rate continues to be lower than both the South East (45.7%) and England (42.0%). It should be noted that this metric includes food waste which became mandatory for all waste collection authorities from the 31st of March 2026, but many authorities already had household food waste collections in place. The above could partially explain why the recycling figure in Southampton is lower than the national average. The percentage sent for recycling excludes any waste collected for recycling but then rejected. In 2024/25, 16.4% of recycling in Southampton was contaminated, similar to the previous year (16.2%). Currently the Materials Recovery Facilities used by Southampton does not have the capability to separate certain recyclables such as pots, tubs and trays which are more widely available to be recycled in other areas. Hampshire is planning to deliver a new recycling facility which aims to increase recycling and lower contamination rates.
Further data on Southampton can be found in the interactive Power BI dashboard linked below. The dashboard allows the user to interact with a range of waste data.
Waste Dashboard
Visualisation
All Local Authority waste
Local authority waste includes household waste plus non-household waste such as street sweepings and fly-tipping clearance plus commercial waste. Local authorities can manage collected waste by sending the waste for recycling, landfill, incineration with energy recovery/without energy recovery or other.
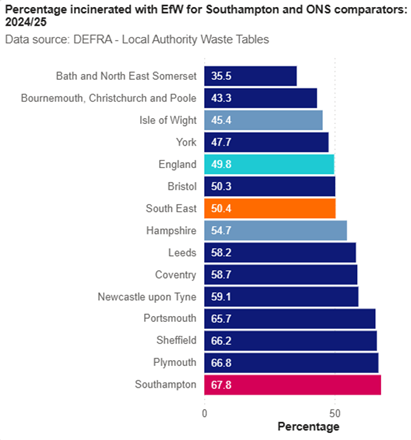
The best form of waste management is recycling as it lowers carbon emissions and reduces the financial and environmental cost to produce new products. However, this method is not possible for all types of waste. Incineration is thought to be next most favourable as it prevents waste pilling up in landfill and potentially causing contamination. In Southampton, incineration involves burning municipal waste at Marchwood Energy Recovery Facility and producing electricity for the National Grid. Finally, landfill is where large holes are filled with non-recyclable waste. This method is least favoured as it can cause environmental issues however it is sometimes the only method for certain waste.
The most common form of waste management for Southampton is incineration with EfW (energy from waste), followed by recycling or composting then landfill. In 2024/25, 67.8% of all Southampton’s waste was sent for incineration with EfW; the highest among comparators. 26.9% was sent for recycling or composting in 2024/25; the second lowest among comparators. 5.3% of Southampton waste was sent to landfill (2024/25), which is lower than the England average (5.5%) but an increase from 3.9% in 2023/24.
Further data on Southampton can be found in the interactive Power BI dashboard linked below. The dashboard allows the user to interact with a range of waste data.
Waste Dashboard
Visualisation
Fly-tipping
Fly-tipping is the illegal disposal of household, industrial, commercial or other controlled waste. It can be liquid or solid waste and dumped on land or in water. The waste is usually dumped to avoid disposal costs. Reducing the incidents of fly-tipping is important to help create greener and safer areas.
Caution should be taken when comparing different areas because of known discrepancies in the way local authorities report the data, as highlighted in the national fly-tipping publication. A high volume of fly-tipping doesn’t necessarily indicate that it is more of a problem, it could be reflective of recording practices.
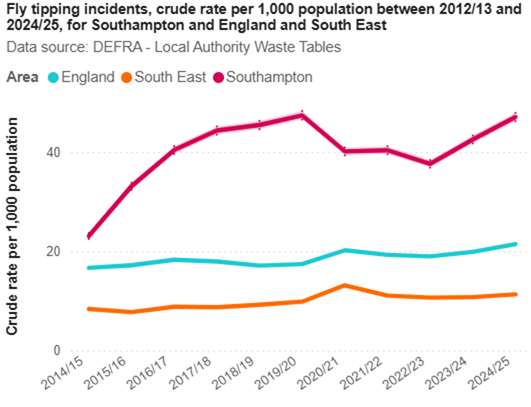
The number of fly-tipping incidents per 1,000 population in Southampton during 2024/25 was 47.1, an increase from last year (42.5 per 1,000 population). The Southampton rate continues to be significantly higher than the South East (11.3 per 1,000 population) and England (21.5 per 1,000 population).
Further analysis can be carried out on fly-tipping incidents by breaking down where the fly-tipping happened (land type), the type of waste that was fly-tipped (waste type) and the size of the waste (volume).
In 2024/25, 46.3% of fly-tipping incidents in Southampton included household black bags (5,648 incidents), with household black bags remaining the most frequently fly-tipped primary waste type.
The most common size and volume for fly-tipping incidents in Southampton during 2024/25 was single black bags (59.2%, 7,226 incidents) followed by single items (23.5%, 2,868 incidents); these have been the two most common incidents since 2013/14.
The most common place for fly-tipping in Southampton during 2024/25 was on council land, with 56.7% of all incidents occurring here, followed by footpaths and bridleways (23.3%) and highways (19.3%).
Further data on Southampton can be found in the interactive Power BI dashboard linked below. The dashboard allows the user to interact with a range of waste data.
Waste Dashboard
Visualisation
Resources
Waste dashboard
The Waste dashboard presents a range of data to provide intelligence on Waste Management in Southampton. Three main topics are covered: household waste, all local authority waste (includes commercial premises and other non-household waste) and fly-tipping.
Waste Dashboard
Visualisation
Department for Environment, Food & Rural Affairs
The Department for Environment, Food & Rural Affairs (DEFRA) publish statistics on waste generation and management. Data is published annually and is available at local authority level which enables local benchmarking and trend analysis to be conducted.
Local authority collected waste management
Report
Fly-tipping statistics for England
Report
Policies and strategies
National and local policies are outlined below.
UK Government – Simpler Recycling in England
Report
Southampton City Council – Waste Improvement and Transformation Plan (2022-2027)
Report
Southampton City Council – Household Waste and Fly-tipping policy (2023-2026)
Report
Southampton City Council – Our Green City
Website
Last updated: 29 June 2026