Carers
Unpaid care overview
Unpaid carers can be found in all sectors of Southampton’s population. Young carers, adults with fulltime jobs, students, people on fixed incomes and older carers will all feel the impact of providing this care. This impact will be felt more acutely by particularly vulnerable groups, including those:
- Over 65 years of age
- Living in areas of greater deprivation
- With long term conditions of their own
These more vulnerable groups of unpaid carers are also more likely to require care themselves due to a higher prevalence of long term conditions and a potential lack of resources (to afford external care).
There are currently two main data sources on unpaid carers in the city, those who have self-reported themselves as providing unpaid care in the 2021 Census and those known to Unpaid Carers Support. Between the two data sources, there may be some age, sex and location differences as well as level of care needed, for those known to Unpaid Carers Support compared to those self reporting as unpaid carers in the Census 2021.
This web page summarises the 2021 Census data of unpaid carers in the city. Also available is a slide set of the analysis of data provided by Unpaid Carers Support.
Provision of unpaid care in Southampton
pdf | 1.6 MB | 17.05.2023
People providing unpaid care by area
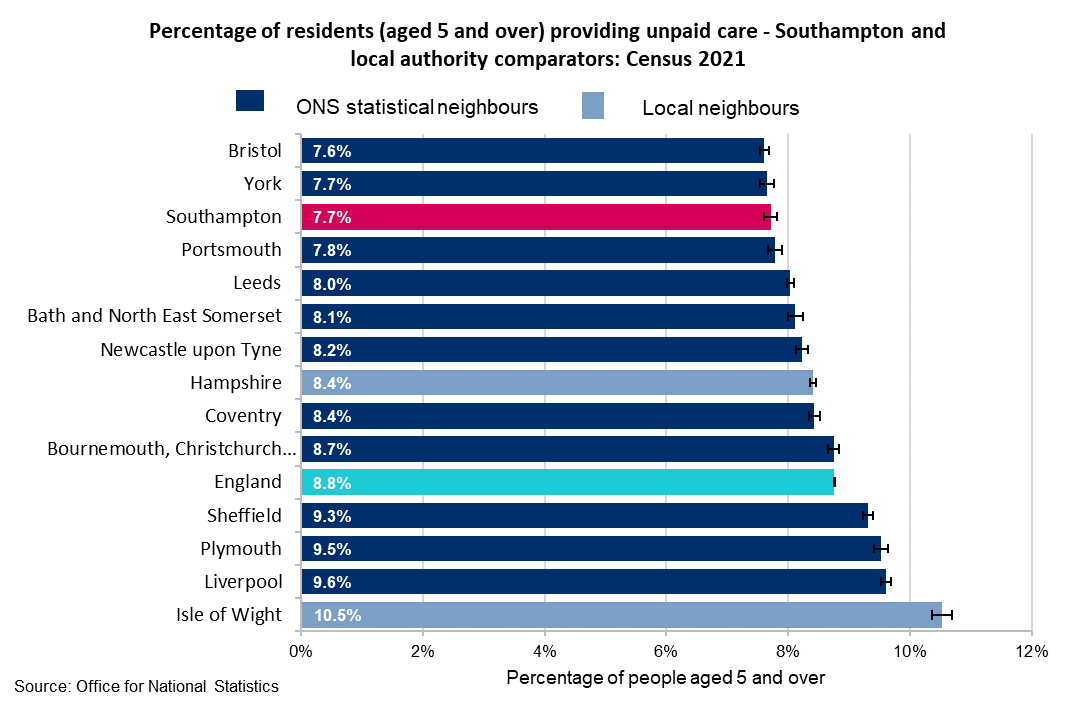 In the 2021 census, 18,136 people (7.7%) said they provide some level of unpaid care in Southampton. This was significantly lower than the England average (8.8%) and was the third lowest rate among Southampton’s ONS comparator group. Significantly more people in Southampton said they were in good health compared to the England average in the 2021 census. This, along with the city’s relatively young population, may explain why there is slightly less unpaid care provided in Southampton.
Southampton has lower percentages of unpaid carers across all age and economic activity groups compared to England. Southampton’s 2021 percentage of unpaid carers was also lower than the 2011 census (8.6%), however ‘unpaid care’ was more tightly defined in the 2021 census question so a robust comparison cannot be made.
Provision of unpaid care in Southampton
pdf | 1.6 MB | 17.05.2023
People providing unpaid care by age and sex
Older groups are more likely to provide unpaid care in Southampton than younger groups, 12.6% of over 50s provide some level of unpaid care in Southampton. Older groups are also more likely to provide more hours of unpaid care. Nearly half (46.8%) of Southampton’s unpaid carers who are aged 65 and over provide more than 50 hours of care a week (1,675 residents). In Southampton 314 unpaid carers are under 16, of which, 103 (a third) provide more than 20 hours of care a week.
In Southampton, 10,586 female and 7,551 male residents aged 5+, provide unpaid care. Females are more likely to be unpaid carers compared to males, 9.0% of females (aged 5+) are unpaid carers and 6.4% of males (aged 5+) are unpaid carers.
Southampton residents providing 20+ unpaid hours of care per week (4.3%) by sex are 5.0% of females and 3.3% of males. Looking at hours provided, 5 out of 10 males and females provide 20+ hours per week of unpaid care and 3 out of 10 give 50+ hours per week. The percentage of residents providing unpaid care increases by age until up to 64 years of age when it starts to decrease for those aged 65 and over, with higher percentages of females providing care for each age group compared to males.
Provision of unpaid care in Southampton
pdf | 1.6 MB | 17.05.2023
People providing unpaid care by ethnicity
Differences in percentages of unpaid carers by ethnicity group may be due to cultural differences or a combination of factors mentioned in this analysis. The white British ethnicity group provide the highest amount of unpaid care from 9.0% of residents in this ethnicity group. This is also group with with the highest percentage reporting in “not good health”.
A higher (80.5%) percentage of residents who are white British, are providing some level of unpaid care compared to the percentage of this ethnicity within the Southampton (68.5%) population. Looking specially at those providing 50+ hours of unpaid care a week across the city, 82.1% of those providing this are white British.
Breaking down hours provided by ethnic group (including the more common sub groups) show whilst 9.0% of white British provide the most unpaid care; Asian Bangladeshi (8.9%) and Black Caribbean (8.8%) also give more than the Southampton average (7.7%). During the pandemic, changes in caring patterns where normally from several individuals in multiple households changed to single individuals from one household in line with government guidelines to reduce infection spread, this may be a factor on the data.
The highest groups by ethnicity providing 20+ hours of care a week, recorded in the 2021 Census were; 5.4% of Asian Bangladeshi (aged 5+), 4.7% of white British (aged 5+) and 4.4% of Black Caribbean (aged 5+). The highest percentage by ethnic group providing 50+ hours is Asian Bangladeshi (3.3%).
A deeper dive looking at differences by sex and ethnicity, showed 53.7% of Asian unpaid carers are females, rising to 60.5% among Asian Pakistani residents. Black unpaid carers are 56.6% females and 58.9% of white British unpaid carers are females.
Provision of unpaid care in Southampton
pdf | 1.6 MB | 17.05.2023
People providing unpaid care within each economic activity group
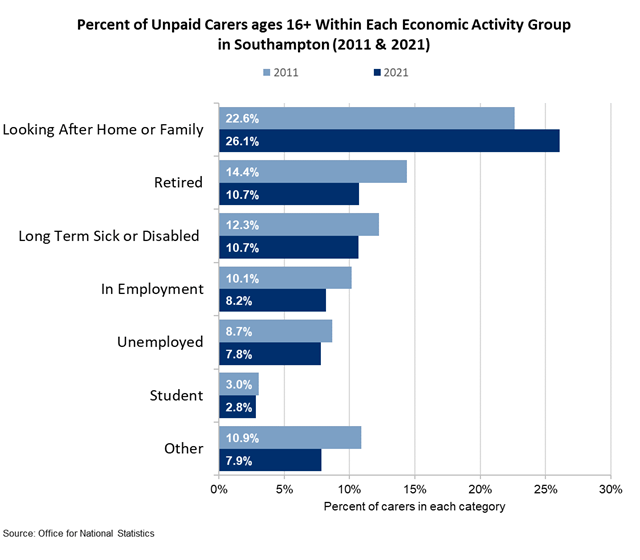 The majority of unpaid carers in Southampton are in employment (51.6%). Nearly half (47.0%) of carers are unemployed or retired. This may put a strain on tight resources or make finding work more difficult. 915 unpaid carers in Southampton have a long term sickness or have a disability.
Whilst the majority of carers are in employment, the percentage of carers in each economic activity group tells a different story. The three economic activity groups most likely to be unpaid carers in 2011 and 2021 are those looking after home or family, retired or those long term sick or disabled. Perhaps some of the most vulnerable groups in the population. More than 1 in 10 retired people in Southampton are providing unpaid care (10.7%). Students are the least likely group in Southampton to be unpaid carers (2.8% of students).
Provision of unpaid care in Southampton
pdf | 1.6 MB | 17.05.2023
People providing unpaid care by health
Detailed analysis shows of 71.1% of unpaid carers are in good health, the percentage of those in good health decreases by age:
- 87.9% - 15 years and under
- 83.3% - 16 to 24 years
- 80.6% - 25 to 34 years
- 74.9% - 35 to 49 years
- 70.1% - 50 to 64 years
- 55.3% - 65+ years
This compares with 82.8% of people aged 5+ who provide no care are in good health. At aged 65 and over, female unpaid carers (57.3%) are more likely to be in good health than males this age (53.1%). Male unpaid carers between the aged of 16 and 64 (76.6%) are more likely to be in good health compared to females (73.5%).
Provision of unpaid care in Southampton
pdf | 1.6 MB | 17.05.2023
Sub-city differences in people providing unpaid care
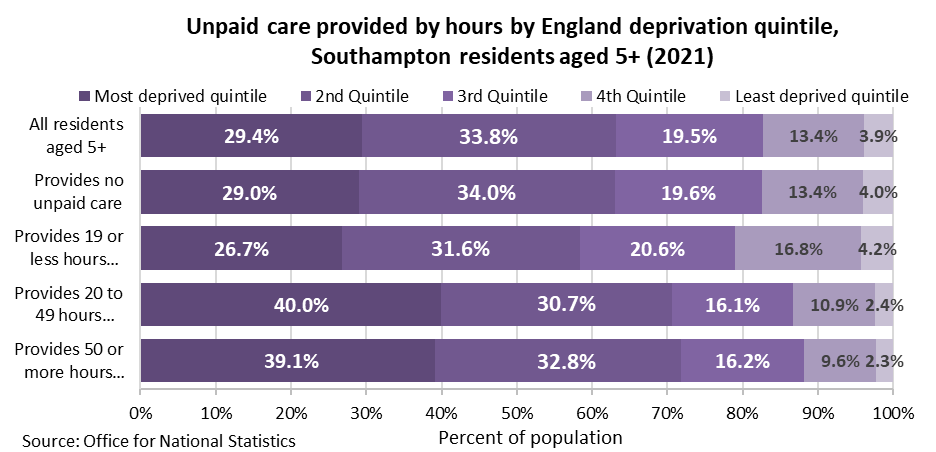 Southampton’s most deprived quintile has the highest percentage of unpaid carers (9.0%) and significantly higher when compared to the least deprived quintile (6.4%) and the remaining quintiles for the rest of the city.
This is shows 1 in 11 residents (age 5+) are unpaid carers in the most deprived compared to 1 in 16 in the least deprived quintile.
More hours of unpaid care per week is provided by residents aged 5+ in the more deprived parts of Southampton compared to the least deprived. Over 70% of care provided by people giving 20+ hours of unpaid care a week comes from people living in the two most deprived quintiles.
The percentage of unpaid carers is lower in Southampton’s North and Central locality. Most of these areas have a younger average age and a larger student population or have more affluence to pay for the provision of care. E01017137 in Banister and Polygon is the least deprived LSOA in the city and has one of the lowest rates of unpaid carers. The four LSOAs (ranked 1 to 4 on the map below) with the highest rates of unpaid carers are all in Southampton’s most deprived quintile.
Provision of unpaid care in Southampton
pdf | 1.6 MB | 17.05.2023
Resources
Provision of unpaid care in Southampton
This slide set illustrates Southampton resident responses to the census 2021 question: "Do you look after, or give any help or support to, anyone because they have long-term physical or mental health conditions or illnesses, or problems related to old age?".
Provision of unpaid care in Southampton
pdf | 1.6 MB | 23.05.2023
Carers in Southampton Analysis
This slide set illustrates analysis of unpaid carers support in Southampton.
Unpaid Carers Support analysis - August 2021
pdf | 3.0 MB | 06.08.2021
Map of provision of unpaid care – 2021 Census
The percentage of unpaid carers is lower in Southampton’s North and Central locality. Most of these areas have a younger average age and a larger student population or have more affluence to pay for the provision of care. E01017137 in Banister and Polygon is the least deprived LSOA in the city and has one of the lowest rates of unpaid carers. The four LSOAs with the highest rates of unpaid carers are all in Southampton’s most deprived quintile
Percent of unpaid carers aged 5 and over in Southampton by LSOA - 2021 Census
ONS - Unpaid care, England and Wales: Census 2021
The number of usual residents aged 5 years and over who provide unpaid care, and how many hours they provide in a typical week, Census 2021 data and a map showing the provision of unpaid care in Southampton.
ONS - Unpaid care, England and Wales: Census 2021
Report
ONS - Unpaid care: Census 2021 map
Visualisation
Last updated: 04 October 2023