Alcohol
Alcohol use overview

If you are worried about your own, or someone else’s use of alcohol, help is available. Please follow this link for local advice, help and support: Drug and alcohol advice
This page summarises key facts and the latest available data on alcohol use and alcohol-related harm in Southampton, with links to support and services.
Alcohol use can cause serious physical and psychological harm to individuals, and can also affect friends, families and communities. In Southampton, it is estimated that 5,355 people have alcohol dependence and may need specialist treatment.
Alcohol use is the leading risk factor for death, ill-health, and disability among 15 to 49-year-olds in the UK, and the fifth biggest risk factor across all ages. Alcohol is a causal factor in more than 200 medical conditions, including:
- mouth, throat, stomach, liver and breast cancers
- high blood pressure
- cirrhosis of the liver
- depression
Alcohol dashboard
Visualisation
Alcohol Use
Alcohol dependence (Southampton)
In 2019-2020, it is estimated that just under 6,000 adults 18+ in Southampton were living with alcohol dependence (rate of 29.4 per 1,000 adults). Due to large confidence intervals for Southampton, this is higher, but not significantly, than the England average of 13.7 per 1,000.
How much alcohol people drink (national estimates applied locally)
National survey data (Health Survey for England 2022) estimates that 48% of adults aged 16+ drink alcohol at least once a week. Applying this percentage to Southampton’s population aged 16+, suggests around 103,000 adults in the city in 2024.
National estimates also suggest that across England, 24% of adults 16+ drink more than 14 units of alcohol a week (a level considered as increasing or higher risk). This is highest among those aged 55 to 64 (30%).
Applying these percentages to Southampton’s population suggests:
- Around 51,400 adults drink more than 14 units of alcohol a week
- Including 7,700 adults aged 55-64
Abstaining and daily limits (national estimates)
In England 19% of adults are thought to abstain from alcohol for a range of reasons. Women are more likely to abstain (22%) than men (16%). In the same survey, 17% of adults reported drinking more than the recommended maximum alcohol limit of 6 units for women or 8 units for men on at least one day in the past week.
Patterns by age and deprivation (national estimates)
Across England, men are more likely to drink alcohol at increasing or higher risk levels. Higher risk drinking is higher among people aged 55 to 74 (for both men and women). Drinking alcohol at an increased or higher risk level is more prevalent in least deprived areas compared to the most deprived (25% vs 17%); those in the most deprived areas had the highest proportion of non-drinkers at 31% compared to the least deprived areas (15%). Despite this, people from lower socio-economic groups, experience greater alcohol related harm. This is sometimes referred to as the alcohol harm paradox.
Other available data shows the average weekly expenditure on alcohol (brought home) in 2023/24 was £8.50.
Children and young people
In the latest Smoking, Drinking and Drug use among Young People in England survey of secondary school pupils (aged 11 to 15 year olds) across England, 15% of 11 year olds had consumed alcohol at some point, rising to 62% by age 15, four times higher. The survey also asked about drinking over the previous 4 weeks, and 10% of 15 year olds reported drinking alcohol (but not been drunk), and 19% reported being drunk.
The most common way of obtaining alcohol was from a parent or guardian (61% of those who had obtained alcohol in the last 4 weeks). Home was a common source; 37% of pupils had taken alcohol from home and 13% had taken it from home without permission. Among current drinkers aged 11-15 years, 73% usually drink at home (higher among 11-12 year olds at 78% than 15 year olds at 70%). 15 year olds are more likely to drink at parties with friends (51%) or somewhere outside (19%). Similar to patterns seen among adults, alcohol consumption among children increased with family affluence. The proportion of children who drank alcohol in the last week increased with the number of drinkers they live with. By deprivation level, young people who live in the 20% least deprived areas were more likely to have drunk alcohol in the last week (9%), just over double compared to young people in the 20% most deprived areas (4%).
Alcohol dashboard
Visualisation
Alcohol hospital admissions
Key messages:
- Southampton’s recorded rates of alcohol-specific and alcohol-related (broad) hospital admissions are higher than England.
- University Hospital Southampton (UHS) routinely asks all inpatients about alcohol use, which may increase identification and recording compared with areas where this is not done consistently.
- Admission rates vary by sex, age, deprivation and ward/locality.
How alcohol-related admissions are measured
Alcohol-related hospital admissions can be used as a measure to indicate the burden of excessive alcohol consumption on the health of a population.
Three hospital admissions measures are used:
- Alcohol-specific hospital admissions: where the primary or any secondary diagnoses are wholly attributable to alcohol.
- Alcohol-related admissions: those where the condition can be partly attributable to alcohol and are reported using two definitions:
- Alcohol-related admissions (broad): include admissions where the primary or any secondary diagnosis is an alcohol-related condition.
- Alcohol-related admissions (narrow): only includes admissions where the primary diagnosis is alcohol-related.
The broad measure can be more sensitive to changes in coding practice over time, while the narrow measure can understate the role of alcohol in admissions. More information can be found in the Local Alcohol Profiles for England.
Why Southampton’s recorded rates may be higher
Southampton is shown to have a higher rate of alcohol-specific and alcohol-related (broad) hospital admissions than England. Alcohol can contribute to many illnesses and treatments. University Hospital Southampton (UHS) seeks to ask Southampton inpatients about alcohol use so the right care can be offered. This is good practice and is not yet standard in other hospitals. It means alcohol use is more consistently identified and recorded in Southampton, leading to higher recorded rates. In other areas of the country, alcohol may contribute to hospital admissions, but be less consistently identified and/or recorded, which can result in lower reported rates.
Alcohol-specific admissions (all ages)
In 2023/24, Southampton’s alcohol-specific hospital admission rate for persons (all ages) was 1,713 per 100,000, a decrease of 13.6% from 1,981 per 100,000 in 2022/23. Females continue to have lower rates than males; however both male and female admissions decreased at a similar rate. Despite these decreases in admissions, Southampton remains the highest among ONS and CIPFA comparators and is significantly higher than England (612 per 100,000). Men are twice as likely as women in Southampton to be admitted to hospital for alcohol-specific health issues, increasing to three times as likely for alcohol-related (broad) admissions.
Alcohol-specific admissions (under 18)
For alcohol-specific admissions among those under 18, the rate has decreased for the first time since 2016/17 - 2018/19. In 2021/22 - 2023/24, Southampton had a rate of 62 per 100,000 admissions, significantly higher than England (23 per 100,000). Unlike admissions for all ages, females under 18 had the highest rate (79 per 100,000) compared to males (44 per 100,000). Female admissions decreased by 22% from 102 per 100,000 in 2020/21 – 2022/23. Male admissions however increased 17% from 38 per 100,000.
Sub-city patterns (alcohol-specific admissions, all ages)
At sub-city level, Bevois ward has the highest rate of alcohol-specific admissions for all ages (4,417 per 100,000), significantly higher than the Southampton average (2,077 per 100,000) in 2021/22 to 2023/24. Bassett ward has the lowest rate of admissions (1,392 per 100,000). North and Central locality has a significantly higher rate than Southampton (2,453 per 100,000), likely reflecting a younger population profile, including large student areas.
By England deprivation quintiles, the 20% least deprived neighbourhoods have the lowest rate of alcohol-specific admissions (1,182 per 100,000). Neighbourhoods in the next least deprived group (4th quintile) have a statistically similar rate (1,276 per 100,000). Admission rates are highest in the 20% most deprived neighbourhoods (2,800 per 100, 000), around 2.4 times higher than the 20% least deprived.
Alcohol-related admissions (narrow): age and sex patterns
Across England, alcohol-related hospital admissions increase with age, peaking at 65+ years for narrow admissions. In Southampton, among people under 40, the gap between male and female admission rates for alcohol-related conditions (narrow) has increased by 35% since 2022/23. In 2023/24, the rate was 251 (males) vs 145 (females) per 100,000 (1.4 times higher). This difference increases with age: males aged 65+ are three times more likely than females of the same age to be admitted for alcohol-related conditions (narrow).
Condition-specific indicators and coding sensitivity
Across the six indicators: cardiovascular disease, liver disease, unintentional injuries, intentional self-poisoning, mental and behaviour disorders (narrow and broad), Southampton’s 2023/24 rates are significantly higher than England for all except unintentional injuries. Southampton’s unintentional injuries admission rate is higher than England’s, but not significantly, (small numbers and wide confidence intervals).
In 2023/24, Southampton’s rate of admission episodes for mental and behavioural disorders related to alcohol (broad) was just over three times higher than England’s rate and has decreased by 42% since 2021/22. For men alone, the admission rate was 1,767 per 100,000 people, compared to 716.3 per 100,000 for women; although both rates have decreased since 2021/22. This indicator may be particularly affected by changes in methods to code admissions since 2018/19.
Alcohol dashboard
Visualisation
Mortality and years of life lost
In 2024, Southampton recorded its first year-on-year decline in mortality rates following 5 consecutive annual increases for both alcohol-specific and alcohol-related deaths. There were 28 alcohol-specific deaths per 100,000 people and 54 alcohol-related deaths per 100,000 people. Alcohol-related mortality is nearly 3 times higher for males than females with 79 deaths per 100,000 males and 27 deaths per 100,000 females in 2024.
In England, 67% of alcohol-specific deaths were male and 33% were female. UK data by age show that 77% of alcohol-specific deaths occur among people aged 40 to 69, increasing with age and peaking at 55 to 64, before decreasing at older ages. In the UK, the main cause of alcoholic-specific deaths was alcoholic liver disease (76%). The proportion of alcohol-specific deaths increases with deprivation. More information can be found on the ONS Alcohol-specific deaths in the UK and NHS England Digital - Statistics on Public Health.
In 2023, Southampton women lost 828 potential years of life (per 100,000 females) due to alcohol, which is significantly higher than England (533 per 100,000). The rate for Southampton males was 1,930 per 100,000, more than double the female rate and significantly higher than the rate for England (1,247 per 100,000).
Alcohol dashboard
Visualisation
Care, treatment and policy
Access to specialist alcohol treatment
In 2024/25, 98% of people in Southampton, who wanted to access specialist alcohol treatment were seen within three weeks. This is an improvement from 68% in 2013/14 and is in line with the England average (98%).
Unmet need and numbers in treatment
Despite shorter waiting times, it is estimated that 86.8% of Southampton adults who are dependent on alcohol were not in contact with alcohol treatment services (2023/24). In 2024/25, 435 adults aged 18+ were in treatment at specialist alcohol services, a crude rate of 2.1 people per 1,000 adults aged 18+ in Southampton, slightly lower than England (2.2 per 1,000).
Treatment outcomes and referral routes
In Southampton in 2023/24, 39.6% of people aged 18+ who left structured alcohol treatment did not re-present (returned for further support) within 6 months, compared with 34.2% across England. For new presentations to specialist alcohol services in 2024/25, 53% were self-referrals or referrals supported by family and friends, 33% were referrals from health and social care services, and 10% were referrals from the criminal justice system.
Alcohol dashboard
Visualisation
Alcohol related crime
Alcohol can be associated with crime and anti-social behaviour, particularly when intoxication affects judgement, self-control and decision-making. Not everyone who drinks alcohol is involved in a crime, but alcohol can increase risk in certain situations.
It is estimated that alcohol is associated with around one million crimes in the UK each year (Institute for Alcohol Studies). In Southampton, 2,493 alcohol affected crimes were recorded in 2024/25, a –4.2% decrease compared with the previous year. Most of alcohol affected crimes were violent crimes (64.7%) which is similar to previous years.
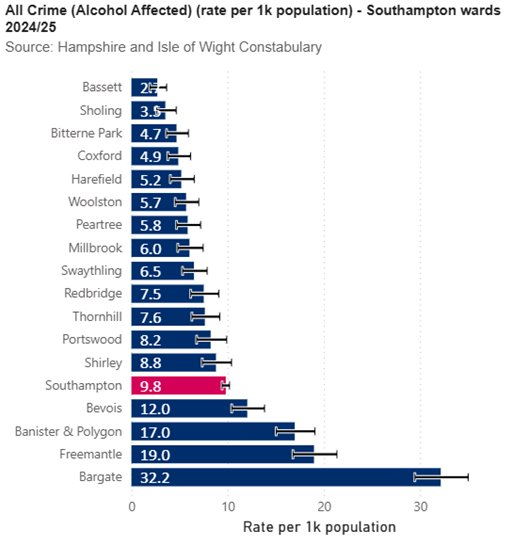
Alcohol affected crime is closely linked to the night-time economy (NTE). Bargate ward continues to have the highest rate of alcohol affected crime in Southampton; and Banister & Polygon, Freemantle and Bevois also have significantly higher rates than the city average. Peak times for alcohol affected crime are late at night and during early hours of the morning on weekends, when night-time economy activity is highest. As with other crime indicators, recorded alcohol-affected crime can be influenced by reporting and recording practices.
For more information on crime in Southampton, see the Safe City Strategic Assessment page.
Resources
Alcohol dashboard
This dashboard shows key alcohol related data for Southampton, England and other comparator cities compiled from publicly available sources including the Office for Health Improvement and Disparities (OHID).
Alcohol dashboard
Visualisation
Tobacco, Alcohol and Drugs Strategy (TAD)
The TAD dashboard presents a range of data to help Southampton City Council monitor progress in reducing the harm related to tobacco, alcohol and drugs—including harms experienced by people who use these substances and people around them, and impacts across the city of Southampton. Progress is monitored through the Tobacco, Alcohol and Drugs Strategy 2023-2028.
Tobacco, Alcohol and Drugs Strategy
Report
Tobacco, Alcohol and Drugs Dashboard (TAD)
Visualisation
Adult Drug and Alcohol Needs Assessment 2025
This review describes the needs, impacts and issues relating to harmful and dependent use of alcohol and illicit drugs in Southampton. It supports the work of the Tobacco, Alcohol and Drug Strategy and was undertaken by an independent organisation, Mike Pattinson Associates.
Adult Drug and Alcohol Needs Assessment 2025
Children and Young People’s Alcohol & Drugs Needs Assessment 2025
This additional Children and Young People’s Alcohol & Drugs Needs Assessment builds on the original (TADV 2023-2024), with an increased focus on qualitative data. This review describes the needs, impacts and issues relating to harmful and dependent use of alcohol and illegal drugs in Southampton. It supports the work of our Tobacco Alcohol and Drug Strategy and was undertaken by an independent organisation, Mike Pattinson Associates.
Children and Young People’s Alcohol & Drugs Needs Assessment 2025 (1)
Drugs dashboard
This dashboard shows key drug related data for Southampton, England and other comparator cities. Data has been compiled from a range of publicly available sources, including the Office for Health Improvement and Disparities (OHID).
Drugs dashboard
Visualisation
Tobacco, Alcohol, Drugs and Vaping (TADV) Needs Assessment for Children and Young People in Southampton, 2023-2024
This is a one-off needs assessment produced by a Public Health Registrar on placement in the Public Health team. It includes: • National prevalence data applied to estimate tobacco, alcohol, drugs and vape use in Southampton. • Local data from survey (BeeWell), Family Nurse Partnership and Children's Services data. • Evidence on harms and impacts related to smoking, alcohol, drug use, and vaping (including crime and hospital admissions). • A description of DASH (children and young people’s drug and alcohol service) service users, and parents in contact with CGL (adult drug and alcohol service). • Interviews with Southampton City Council and DASH staff to provide qualitative insights.
Tobacco, Alcohol, Drugs and Vaping (TADV) Needs Assessment for Children and Young People in Southampton, 2023-2024
pdf | 1.7 MB | 18.06.2024
2024/25 PHAR - Hope and Help: Reducing tobacco and alcohol harm in adults
This year’s annual report focuses on the importance of reducing tobacco and alcohol harm in adults as part of the council’s commitment to making Southampton a healthier, more equal city. The report highlights the benefits of stopping smoking and reducing alcohol consumption, drawing on real life, heartfelt and hopeful stories.
2024/25 PHAR - Hope and Help: Reducing tobacco and alcohol harm in adults (old)
Using a telephone line to deliver Extended Brief Interventions to support people with alcohol use disorders
The Alcohol Telephone Line provides a short-term, open-access confidential service for people who are worried about their drinking. It offers Extended Brief Intervention for people who need more support than is usually available through universal services (such as GP practices), but who do not need structured alcohol treatment. The specialist Substance Use Disorder Service runs a separate free telephone line. It can be accessed directly, without a referral. The poster below presents the results from the service between October 2020 and December 2022.
SCC Public Health Poster Telephone Line
Visualisation
Safe City Strategic Assessment 2024/25
The Southampton Safe City Strategic Assessment provides an overview of current and future crime, disorder and community safety issues affecting Southampton, and makes recommendations to enable the Partnership focus the Safe City Strategy and local delivery plans. The report and slide set that informed the assessment are available below to download. The interactive community safety dashboard can be accessed using the link below.
2024/25 Safe City Strategic Assessment report
2024/25 Safe City Strategic Assessment presentation
pdf | 5.7 MB | 12.12.2025
Community Safety Dashboard
Visualisation
Data sources
Other useful alcohol related websites
OHID Fingertips – Local Alcohol Profiles for England (LAPE)
Website
OHID - Adult substance misuse treatment statistics
Website
ONS - Alcohol-specific deaths in the UK
Dataset
NHS Digital – Smoking, drinking and drug use among young people in England, 2023
Report
NHS Digital - Statistics on Public Health
Dataset
Institute of Alcohol Studies – Alcohol Knowledge Centre
Website
Drug and alcohol advice
If you are worried about your own, or someone else’s use of alcohol or/and drugs, help is available.
Drug and alcohol advice
Website
Last updated: 26 January 2026