Life expectancy
 Life expectancy
Life expectancy is a useful summary measure of the overall mortality and morbidity in a population.
There are different variations of life expectancy measures. The most used is life expectancy at a given age, often at birth or at age 65. This is the average number of years a person would live, if they experienced the area’s age-specific mortality rates for that time throughout their life. Figures reflect mortality among those living in an area in each time period, rather than what will be experienced throughout life among those born in the area. The figures are not therefore the number of years a baby born in the area could expect to live, both because the mortality rates of the area are likely to change in the future and because many of those born in the area will live elsewhere for at least some part of their lives.
Other variations include healthy life expectancy and disability-free life expectancy which try to consider quality of life in addition to quantity.
Benchmarking and trends data uses ONS Mid-Year Estimate population to calculate rates. For sub-city analysis, Small Area Population Forecasts (SAPF) from Hampshire County Council is used to calculate rates. Across these analyses averages for Southampton as whole will differ as a result. Also Ward and locality totals for the city values may not match deprivation quintile city totals due to the affect of 2023 electoral ward boundary changes.
Life expectancy and mortality dashboard
Visualisation
Life expectancy at birth
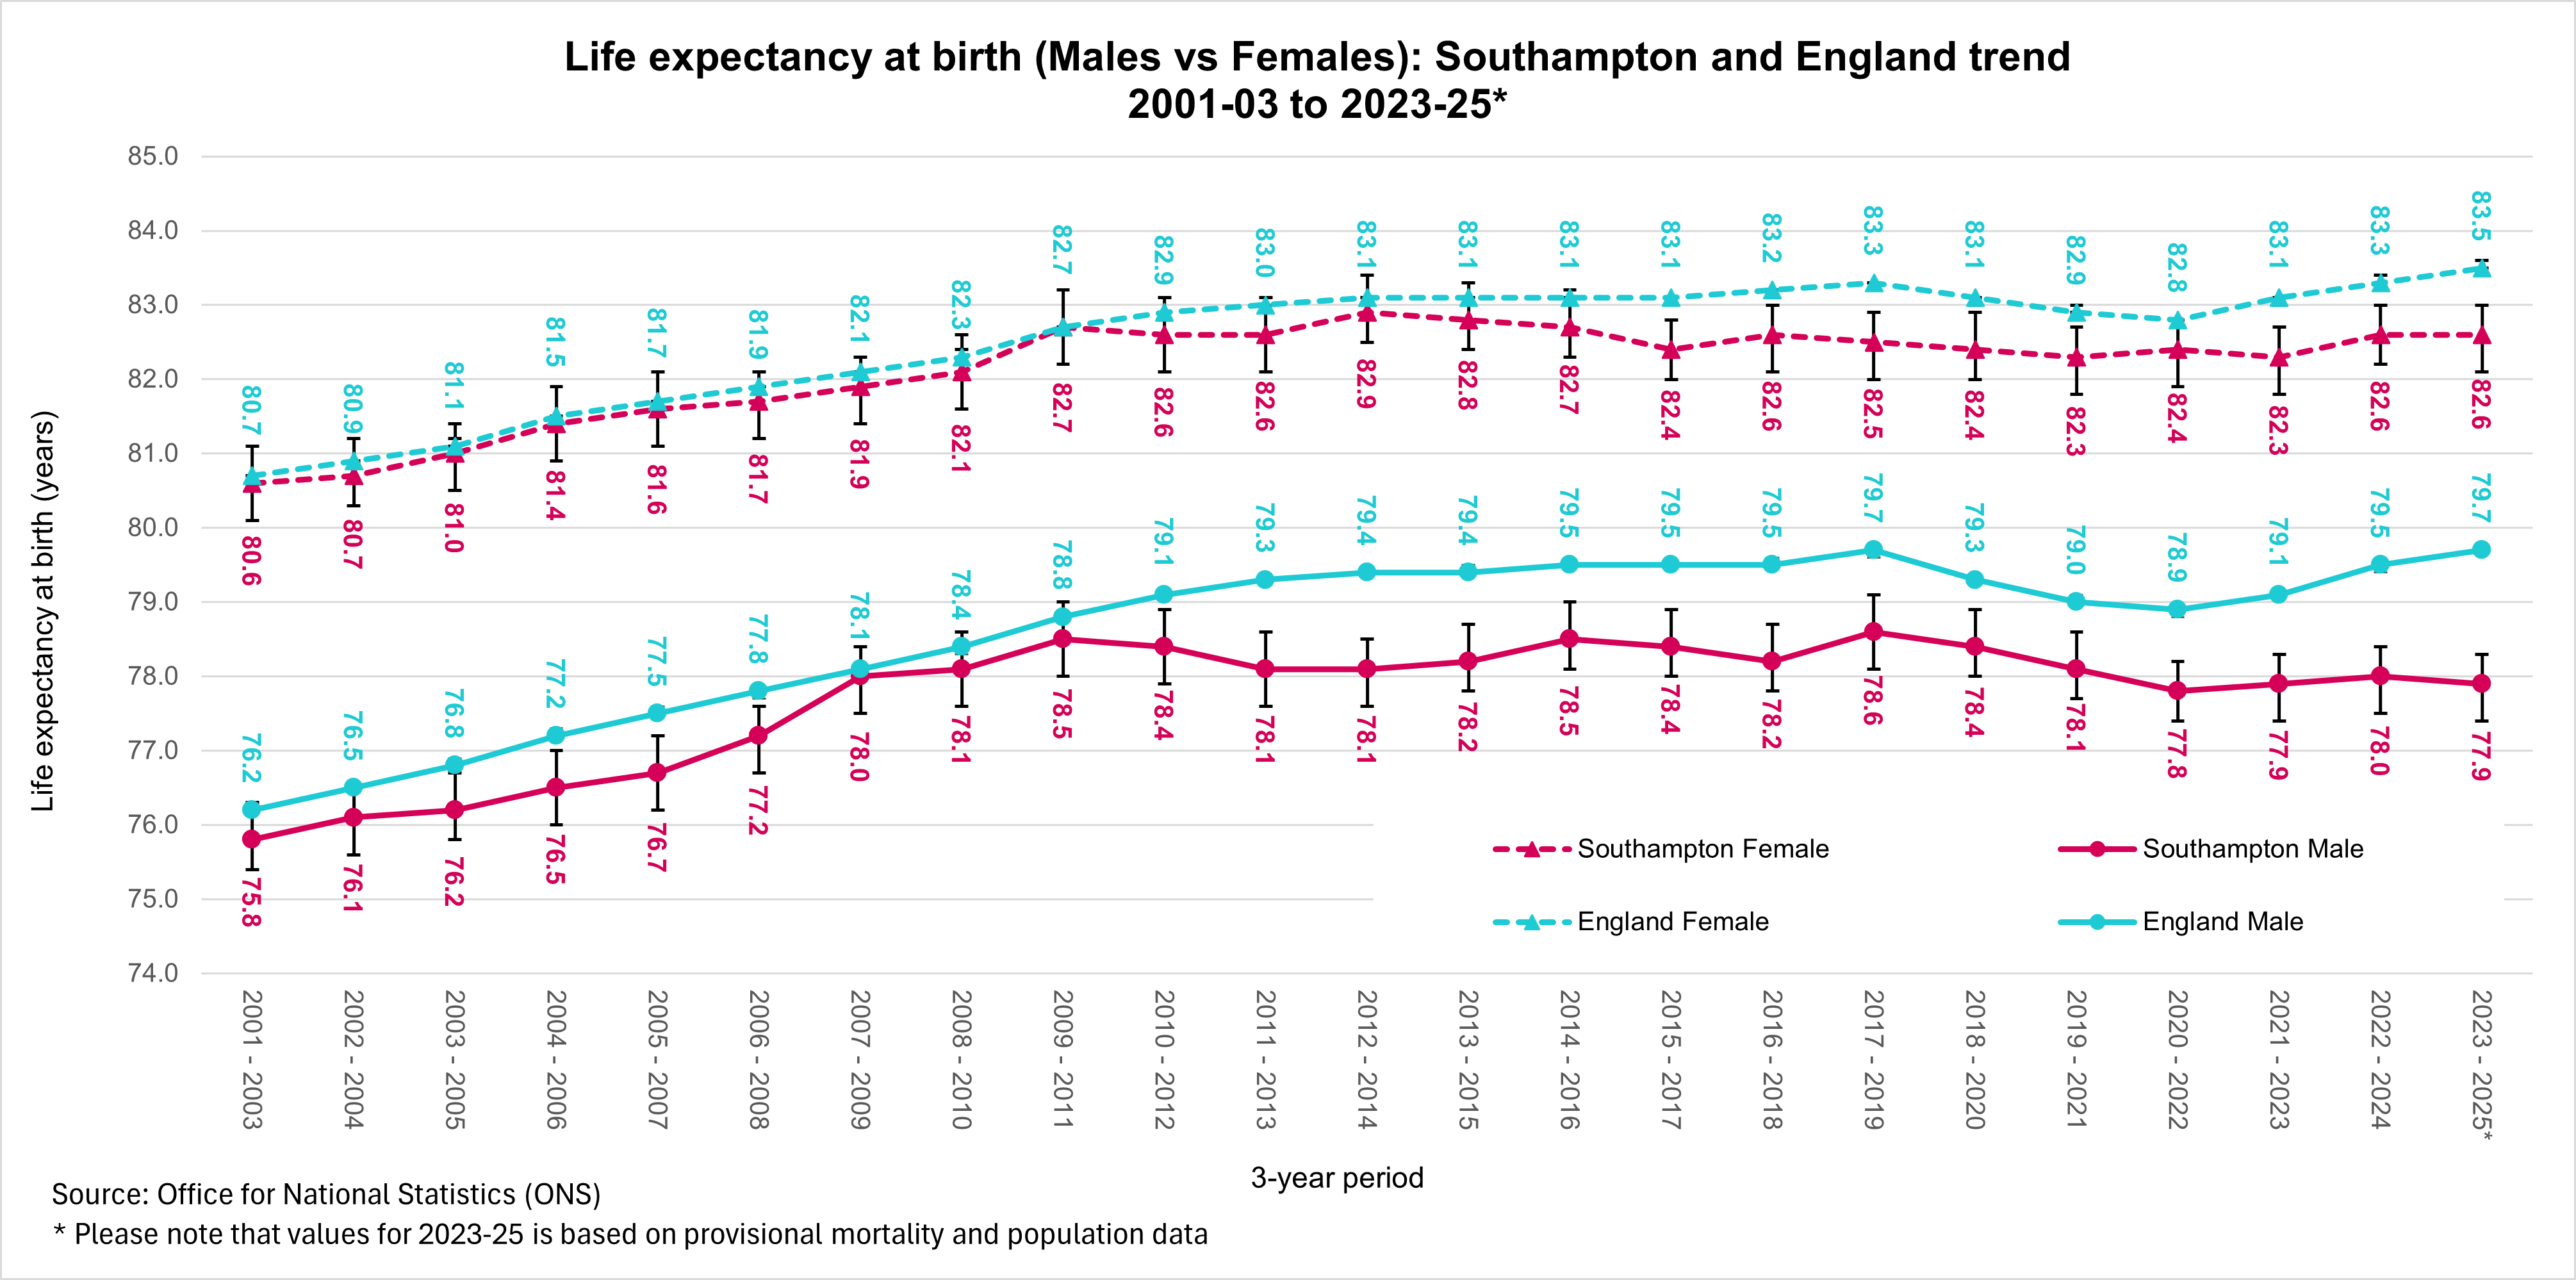 Life expectancy at birth for males living in Southampton is currently estimated to be 77.9 years for the 2023-25 (pooled) period, significantly lower than the England average male life expectancy of 79.7 years and ranked 7th highest among our CIPFA comparators. Male life expectancy had been decreasing in Southampton since the highest recorded in 2017-19 (pooled) period, in line with the England trend. Between 2010-12 and 2019-21 (pooled) male life expectancy has plateaued around the 78 year mark, failing to keep in line with overall England increases since over the same period. The data periods overlapping the pandemic; 2018-20, 2019-21 and 2020-22 saw drops in life expectancy for England and Southampton. England saw an increase in life expectancy between 2022-24 and 2023-25 from 79.5 years to 79.7 years whereas Southampton saw a decrease in life expectancy of around a month from 78.0 to 77.9 years.
Female life expectancy at birth is 82.6 years (2023-25 pooled), which is significantly lower than the England average of 83.5 years, but the 3rd highest among our CIPFA comparators. Since 2015-17 Southampton female life expectancy has been significantly lower than the England average. Since 2014-16 the gap in female life expectancy between Southampton and England has been widening. Similar to males, female life expectancy in Southampton and England for 2018-20, 2019-21 and 2020-22 encompassing COVID-19 pandemic mortality, dipped compared to life expectancy for 2017-19. Please note that values for 2023-25 is based on provisional mortality and population data.
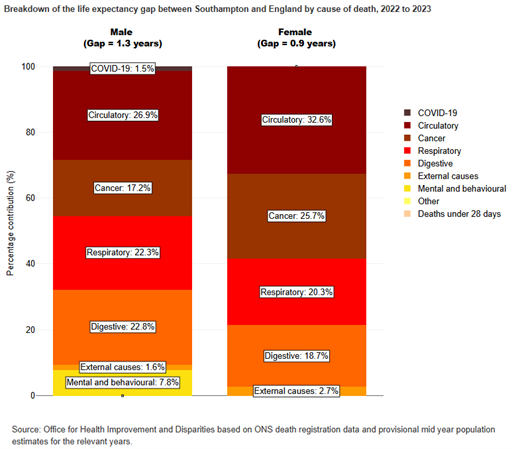 The Office for Health Improvement and Disparities (OHID) have produced an inequalities segment tool which shows the relative contribution that nine broad causes of death have on the gap between life expectancy for Southampton and that for England for the 2022 to 2023 period.
Circulatory (26.9%), digestive (22.8%) and respiratory (22.3%) disease deaths are the largest groups contributing to the gap in male life expectancy between Southampton and England with heart disease being the highest detailed caused, followed by chronic lower respiratory diseases and cirrhosis & liver disease.
For females, circulatory diseases (32.6%), cancer (25.7%) and respiratory (20.3%) deaths are the largest groups contributing to the gap in life expectancy. As with males, heart disease is the highest detailed cause, followed by chronic lower respiratory diseases and other cancer.
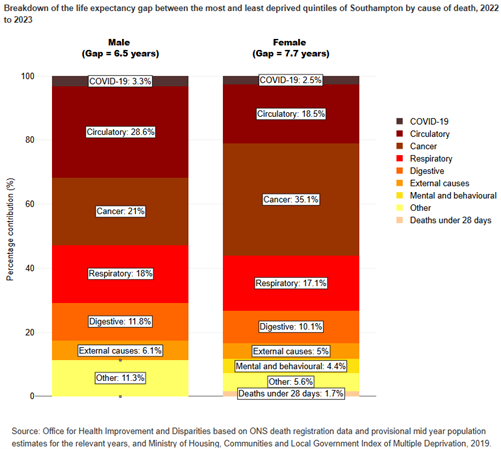 The gap in life expectancy can also be analysed by the most and least deprived quintiles in Southampton. Circulatory disease (28.6%), cancer (21.0%) and respiratory (18.0%) deaths are the largest groups contributing to the gap in male life expectancy between the most and least deprived quintiles in Southampton. On closer inspection, the two largest causes are heart disease followed by chronic lower respiratory disease.
For females, cancer (35.1%) is the largest cause contributing to the gap in female life expectancy between the most and least deprived quintiles in Southampton, followed by circulatory diseases (18.5%) and respiratory diseases (17.1%). More detailed analysis shows the single largest cause of the gap in female life expectancy is other cancer, followed by chronic lower respiratory diseases and lung cancer. COVID-19 contributed 3.3% to the gap in male life expectancy and 2.5% to the gap in female life expectancy.
More information about inequalities is available in the life expectancy and mortality dashboard and in the health inequalities section.
Life expectancy and mortality dashboard
Visualisation
Life expectancy at 65
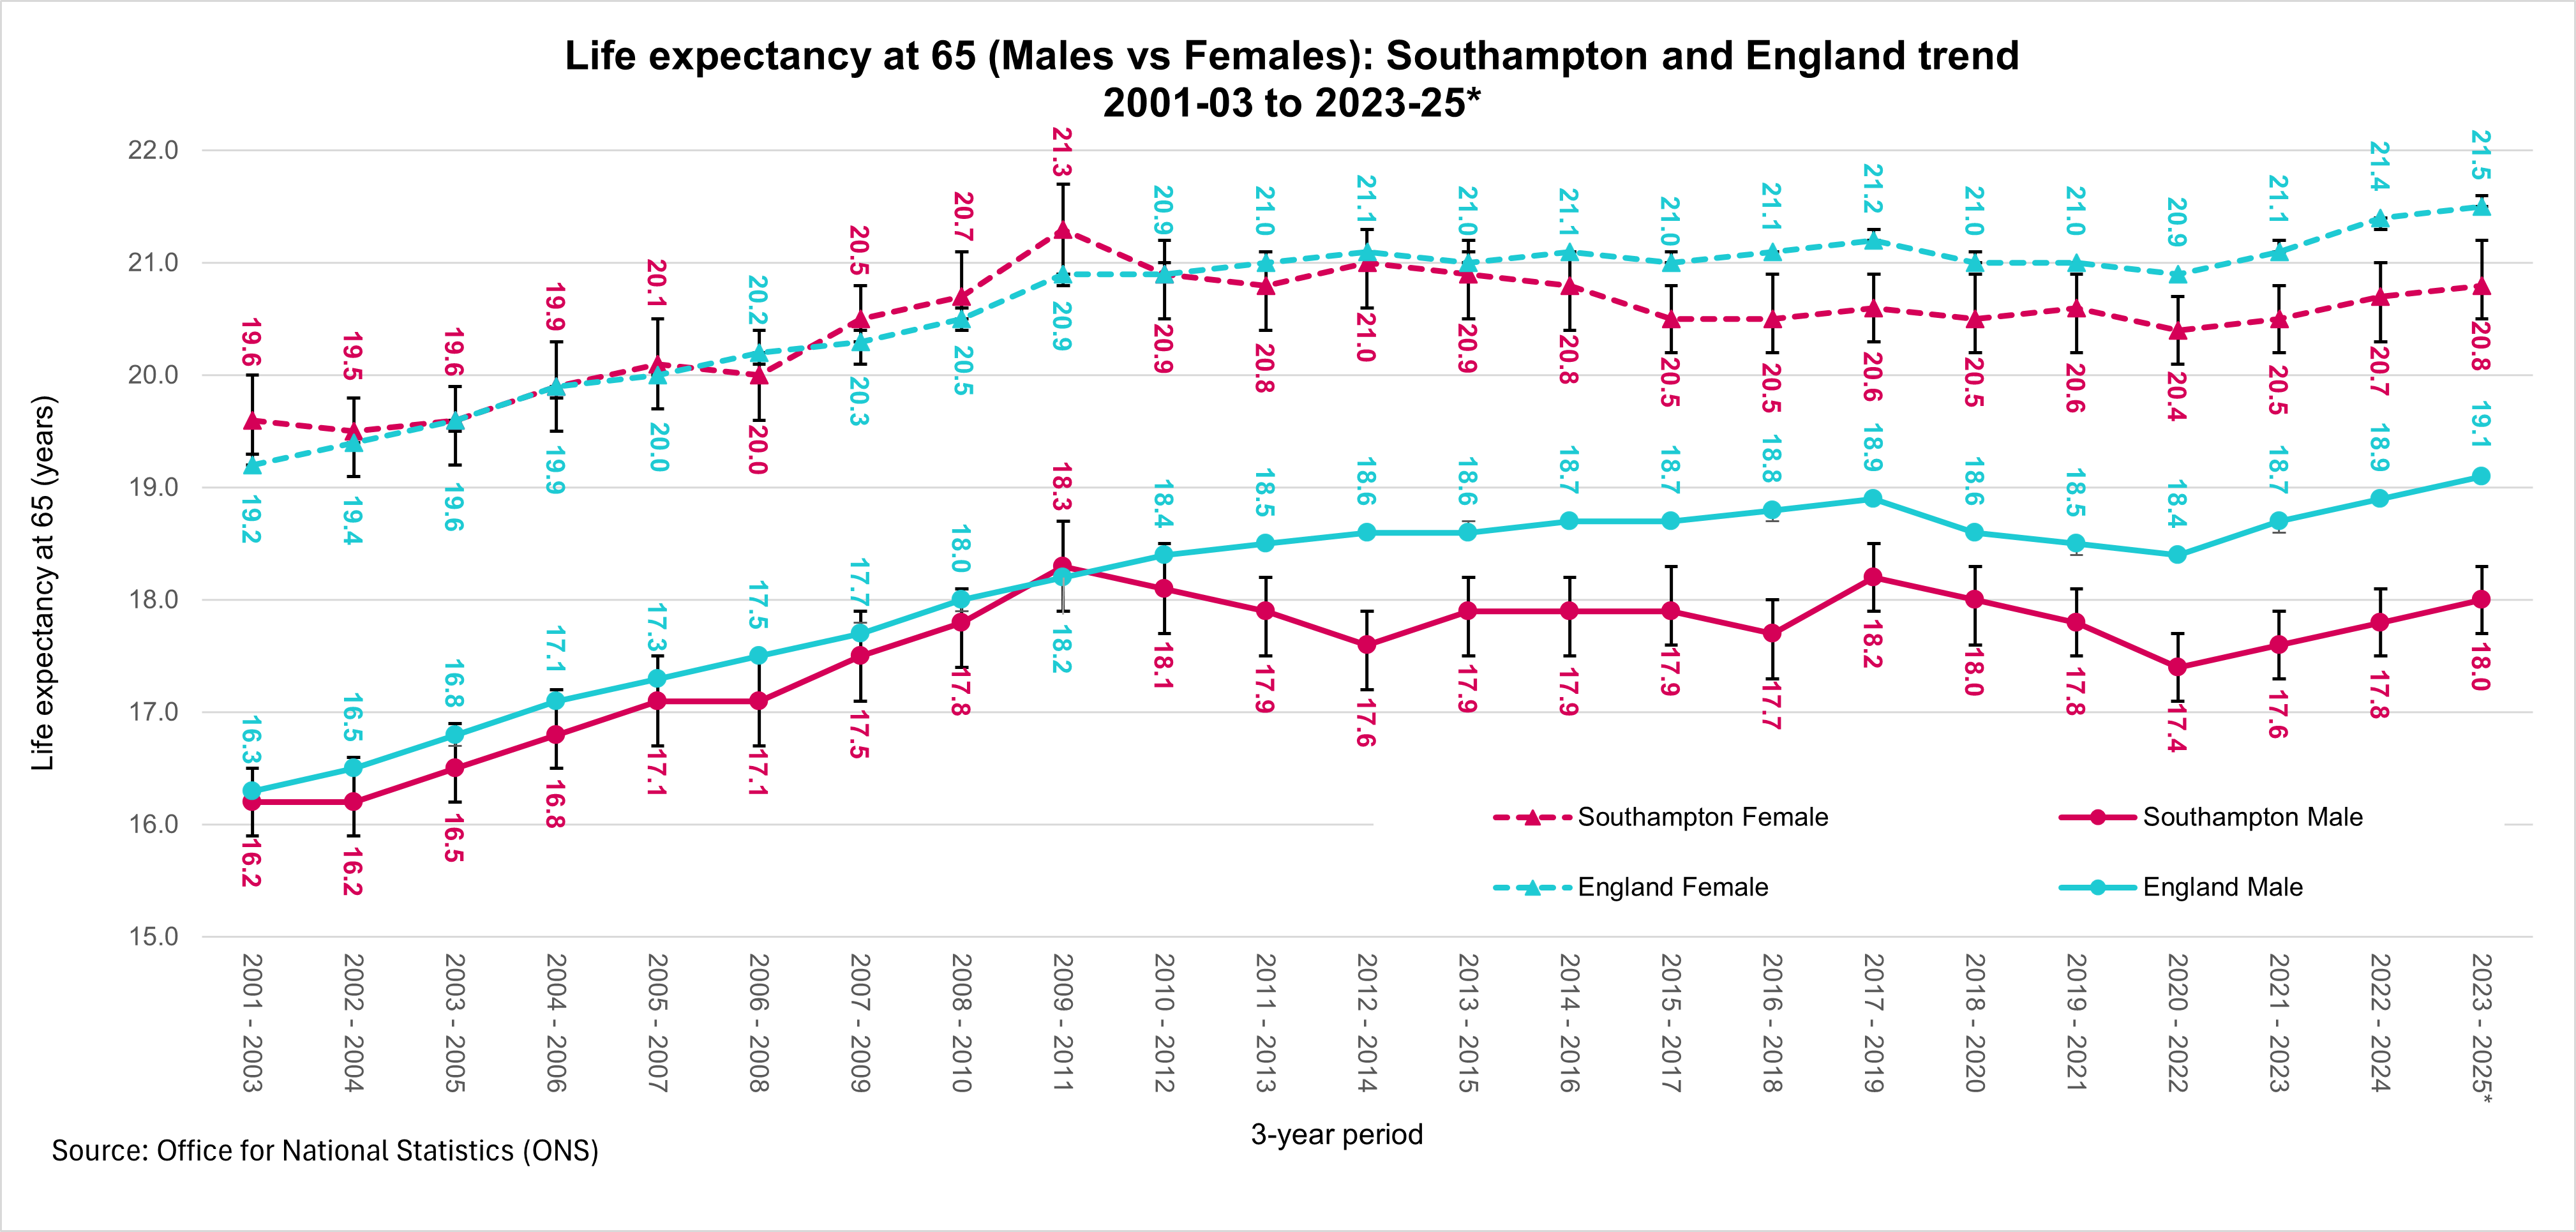 Life expectancy at 65 in Southampton mirrors the trends seen for life expectancy at birth for both males and females. Male life expectancy at 65 for the period 2023-25 is 18.0 years, the 6th highest among our CIPFA comparators and significantly lower than the England average of 19.1 years.
Male life expectancy at 65 peaked at 18.3 years in 2009-11, slightly higher than the England average of 18.2 years. The England average rose to 18.9 years in 2017-19 and since falling to 18.3 years in 2020-22 (most likely a factor of the pandemic) is now higher than pre-pandemic levels. Life expectancy at 65 has increase in both Southampton and England since 2020-2022.
Female life expectancy at 65 is 20.8 years, the 3rd highest among our CIPFA comparators and significantly lower than the England average of 21.5 years. Female life expectancy at 65 peaked in 2009-11 (pooled) at 21.5 years. In comparison, life expectancy for England continued to increase and now peaking at 21.4 years, significantly higher than life expectancy in Southampton. Please note that values for 2023-25 is based on provisional mortality and population data.
Since the 2001-03 (pooled) period, Southampton’s life expectancy at 65 has been consistently lower than its local neighbours, Hampshire and the Isle of Wight, for both males and females.
More information is available in the dashboard below and in the resources section.
Life expectancy and mortality dashboard
Visualisation
Healthy life expectancy
 Healthy life expectancy (HLE) is an estimate of the number of years lived in good health (rather than with a disability or in poor health), based on mortality rates and prevalence of self-reported good health.
In 2022-24, in Southampton, healthy life expectancy for males was 57.6 years, which is lower but not significantly than the England average of 60.9 years. For females, in the same period, healthy life expectancy in Southampton is 59.0 years, which again is lower but not significantly than the England average of 61.3 years. This suggests that in Southampton there is a wider healthy life expectancy gap (1.4 years) between males and females than that seen nationally (0.4 years).
Whilst healthy life expectancy in England has remained relatively stable over the last decade, there has been more variation in Southampton, particularly for females. In 2019-21 (pooled) period, female healthy life expectancy increased to 64.0 years before falling to 59.0 in the latest period (2022-24).
At sub-city level in 2017-21, Thornhill has the lowest healthy life expectancy for males (60.1 years) and Bevois has the lowest healthy life expectancy at birth females (61.2 years), whilst Bassett has the highest HLE with 68.6 years for males and 70.4 years for females (excluding Bargate due to unreliability of small numbers for certain age bands in the calculations).
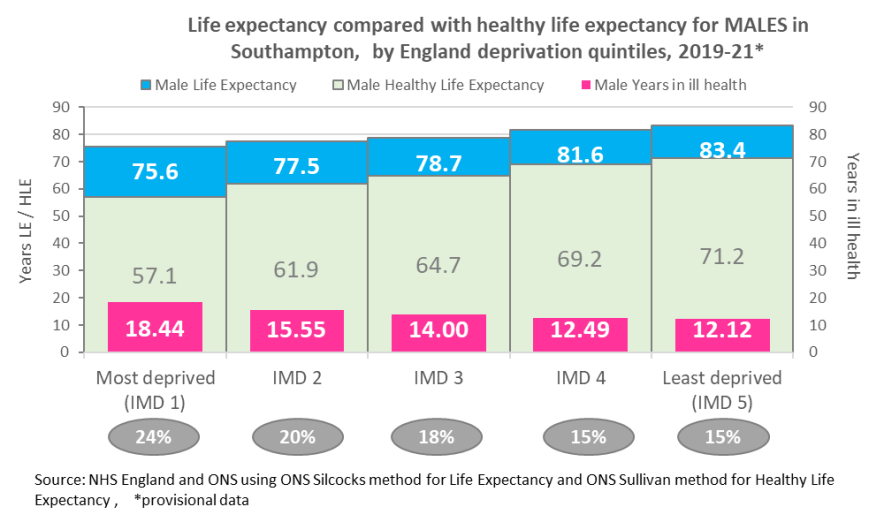
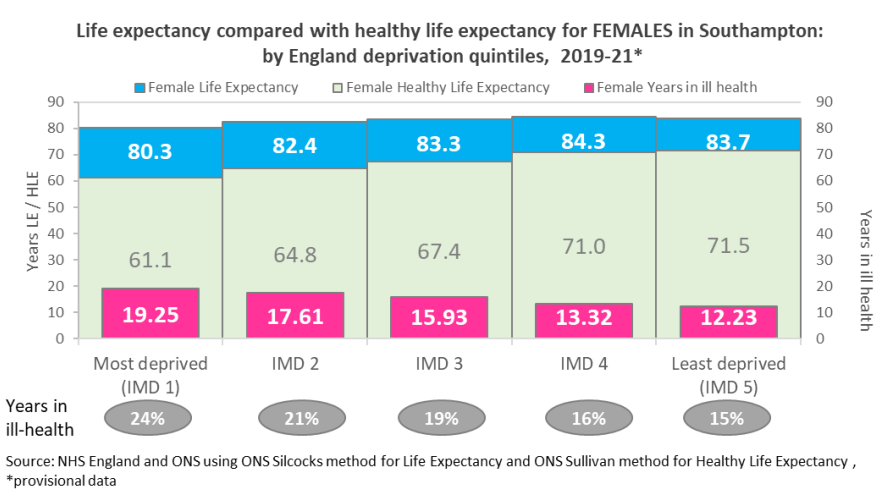 Health inequalities analysis includes comparing life expectancy and health life expectancy for males and females by deprivation quintile and assessing how many years people live in poorer health. Both males and females in the most deprived quintile live a quarter (24%) of their shorter lives in ill health. Males and females in the least deprived quintile live a seventh (15%) of their lives in ill health.
More information and data on healthy life expectancy can be found in the life expectancy and mortality dashboard below and in the resources section.
Life expectancy and mortality dashboard
Visualisation
Disability-free life expectancy
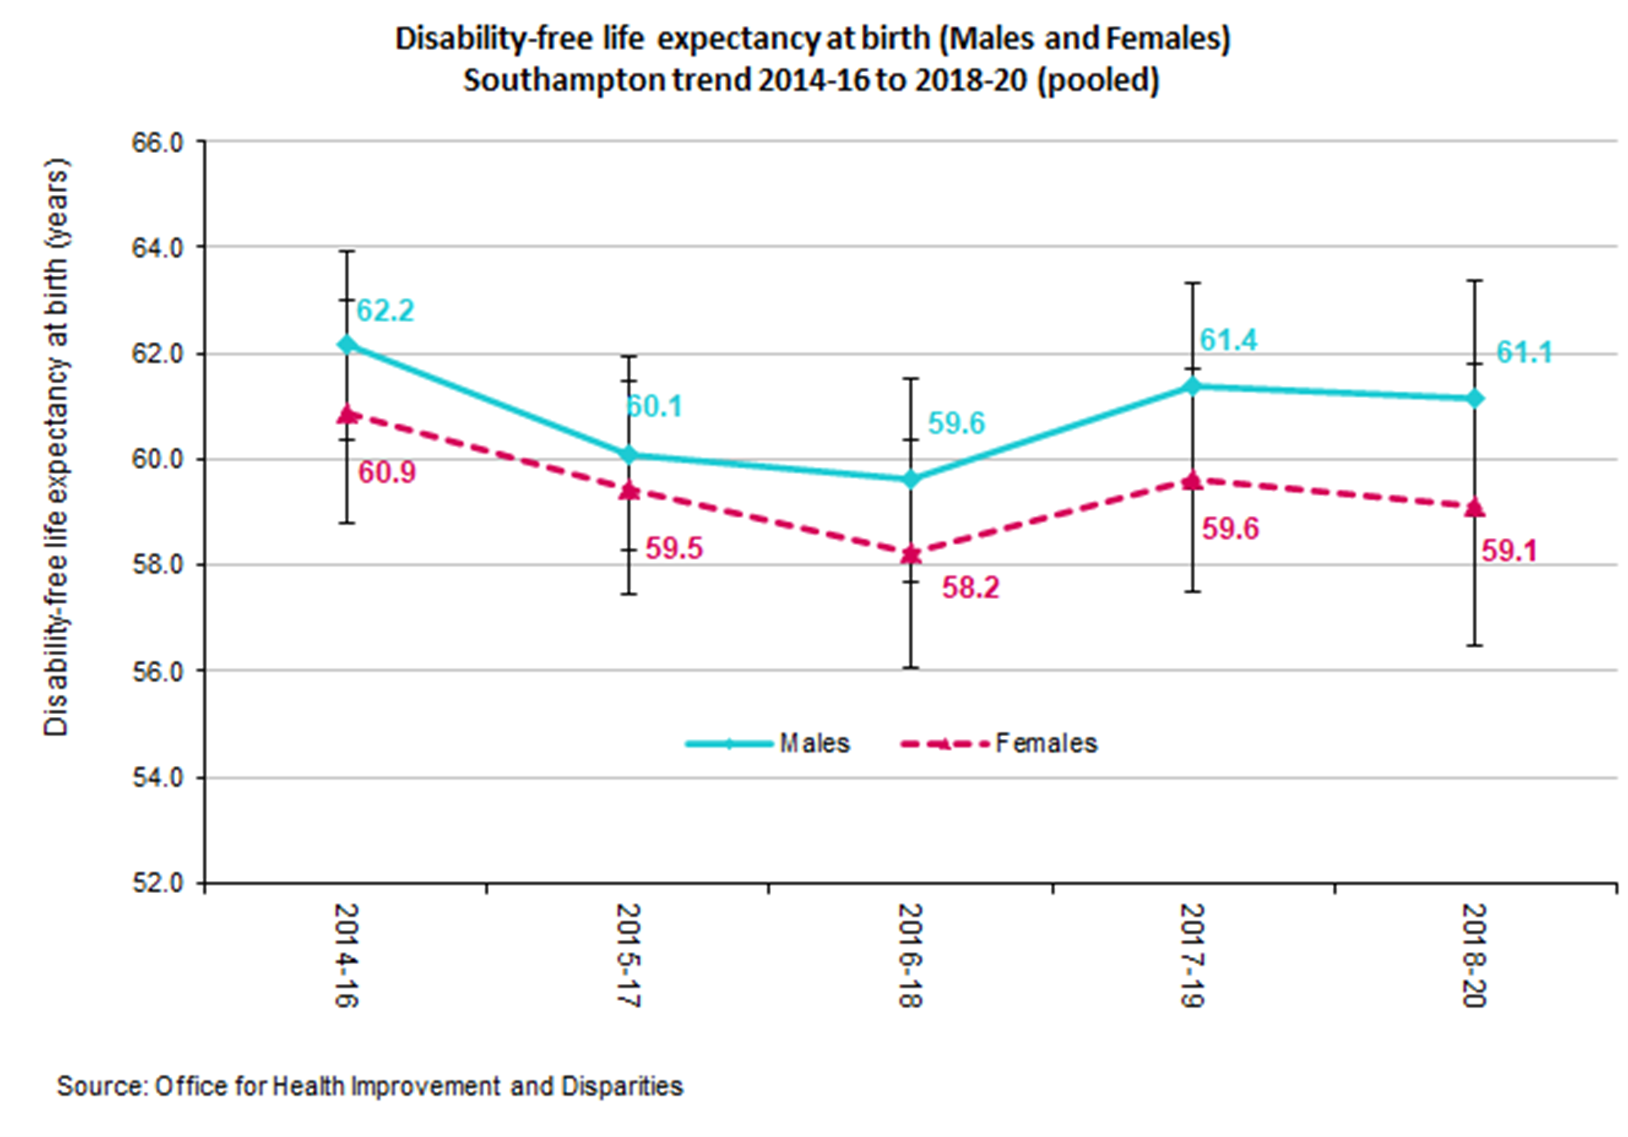 Disability-free life expectancy (DFLE) is an estimate of the number of years lived without a long-term physical or mental health condition that limits daily activities. In 2018-20, males in Southampton could expect to live 61.1 years disability-free, which is lower than the England average of 62.4 years, although not statistically significantly so. Despite females living longer than males, in Southampton and nationally, women live fewer years disability-free. In Southampton females have a disability-free life expectancy of 59.1 years, which is slightly lower than the England average of 60.9 years, although not statistically significantly so. Since 2014-2016, disability-free life expectancy of both males and females has decreased in Southampton at a quicker rate than nationally.
Disability-free life expectancy may differ from healthy life expectancy due to the self-reported nature of how the measures are calculated. For example, an individual may be disability-free but self-report that they are not in good health or vice versa.
More information can be found in the resources section below.
Resources
Life expectancy and mortality dashboard
The life expectancy and mortality dashboard present a range of data regarding life expectancy and mortality, to provide intelligence to help drive strategic decision making. Analysis includes benchmarking against statistical neighbours and trends over time for all indicators included. Some indicators include analysis at sub-city levels, by Southampton wards, primary care networks (PCNs) and deprivation quintiles.
Life expectancy and mortality dashboard
Visualisation
OHID - Fingertip tools
Office for Health Improvement and Disparities (OHID) have produced several tools that allow for the exploration of life expectancy. The Fingertips tools produced by PHE bring together data on several indicators at local authority level and can be used to explore the data over time and between comparator areas. PHE have also produced an inequalities segment tool which provides information on the causes of death and age groups that are driving inequalities in life expectancy at local area level. Targeting the causes of death which contribute most to the life expectancy gap should have the biggest impact on reducing inequalities.
OHID - Life expectancy and mortality
Dataset
OHID – Life expectancy calculation tool (xls)
Dataset
ONS – Life expectancy
The Office for National Statistics (ONS) have produced several reports, tools and datasets that investigate life expectancy and mortality in detail.
ONS – Life Expectancy releases and their different uses
Report
ONS – Life expectancy estimates, all ages, UK
Dataset
ONS - Health state life expectancies, UK: 2020 to 2022
Report
ONS - Life expectancy calculator
Report
Last updated: 22 May 2026