Winter Mortality
Winter Mortality
 Excess winter deaths are estimated by comparing the four winter months: December to March with the average of the four-month periods before and after. An estimated 13,400 excess winter deaths occurred in England and Wales in winter 2021 to 2022, this was the second lowest figure since winter 1950 to 1951 and was affected by the larger number of deaths in the non-winter months (August 2021 to November 2021 and April 2022 to July 2022).
The number of excess winter deaths depends on the temperature and the level of disease in the population as well as other factors, such as how well equipped people are to cope with the drop in temperature. Most excess winter deaths are due to circulatory or respiratory diseases and the majority occur amongst the elderly population.
Sub-city analyses uses the OHID old method as the new post-pandemic method is not recommended for being statistically robust for small geographies.
Life expectancy and mortality dashboard
Visualisation
Winter mortality in all ages
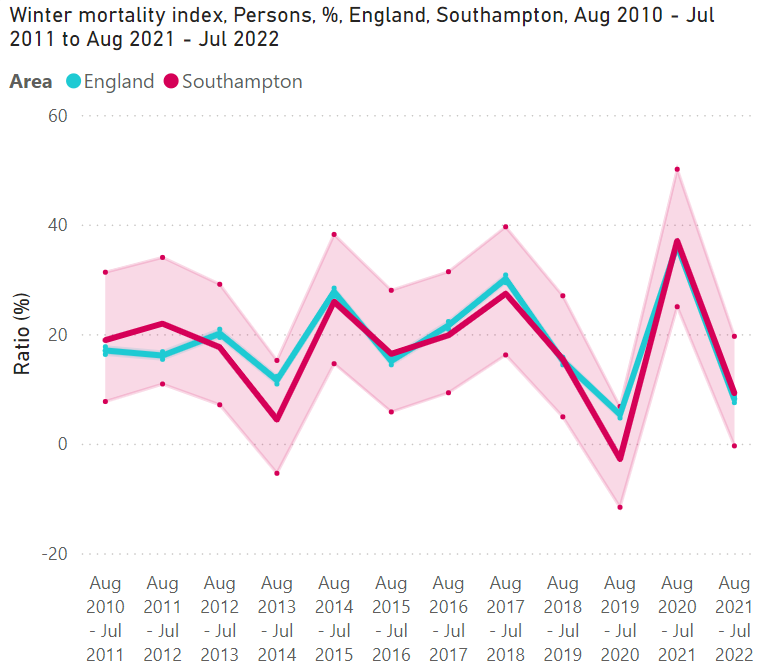 The winter mortality index (which is used to compare between sexes, age groups and geographical areas) in England for August 2021 to July 2022 was significantly lower than every winter since the series began in 1991 to 1992, except in 2019 to 2020 (7.3%).
The winter mortality index in 2021 to 2022 was higher for some groups when making comparisons between them. It was higher for males than females, for people aged 90+ compared to those younger and also for those living in a private home in England compared to those living elsewhere (such as care homes and hospitals).
COVID-19 is the leading cause of excess winter deaths that occurred in 2021 to 2022 with 25.9% more deaths occurring in the winter than non-winter in England.
In the winter mortality index, Southampton had an estimated 60 (9.2%) excess winter deaths, all ages, occurring in the winter 2021 to 2022. This is higher compared with 8.1% in England and places Southampton the 5th highest among Southampton’s ONS comparators, where the highest was 15.2% in Bournemouth, Christchurch and Poole. Pandemic patterns of mortality have affected winter mortality which saw a spike in August 2020 to July 2021 of 210 excess deaths in Southampton. This is compared with the year before where there were 20 less deaths in the winter months than the summer months, and the year after which had an excess of 60 more deaths.
 In Southampton’s wards, between 2019-20 to 2021-22 (3 years pooled) Thornhill (42.1%) and Swaythling (30.2%) have the highest levels of winter mortality. This is compared to 13.4% for Southampton over the same period and -17.4% in Bevois (a negative number means there are fewer winter deaths than summer ones).
Looking at sub-city deprivation patterns, for England quintiles, between 2019-20 to 2021-22 (3 years pooled), the 4th quintile had the highest winter mortality (15.0%) followed by the 20% most deprived areas (14.6%). The 20% least deprived areas had a ratio of -2.3%. There is little evidence to show a clear relationship between deprivation and winter mortality.
North and Central locality had the highest level of excess winter deaths (16.9%), higher than the Southampton average of 13.4%. Both East and West locality (10.7% and 11.1% respectively) were below the Southampton average.
Life expectancy and mortality dashboard
Visualisation
Winter mortality in ages 85+
 Excess winter deaths for those aged 85+ are estimated by comparing those deaths in the four winter months: December to March with the average of the four-month periods before and after. The number of excess winter deaths depends on the temperature and the level of disease in the population as well as other factors, such as how well equipped people are to cope with the drop in temperature. Most excess winter deaths are due to circulatory or respiratory diseases and the majority occur amongst the elderly population.
For those aged 85+ for the period 2019 to 2020, there were estimated to be -20 (-6.6%) excess winter deaths, this means there were more deaths in the summer months than the winter months; a feature of the pandemic. This compares with 6.8% in England, which had more winter deaths than summer. In 2021 to 2022, there were estimated to be 30 excess deaths (13.3%) in Southampton, higher than England (11.3%) and ranking the 5th lowest compared to its ONS comparators, Bristol was the highest at 19.8% and Portsmouth has the lowest ratio of 5.4%.
In Southampton’s wards for the period 2019-20 to 2021-22, (3 year pooled) for those aged 85+, the highest ratio areas are Thornhill (77.1%) and Swaythling (52.0%). This is compared to 16.5% in Southampton. Bevois has the lowest ratio of -14.3%, a negative number meaning that there are more deaths during the summer months.
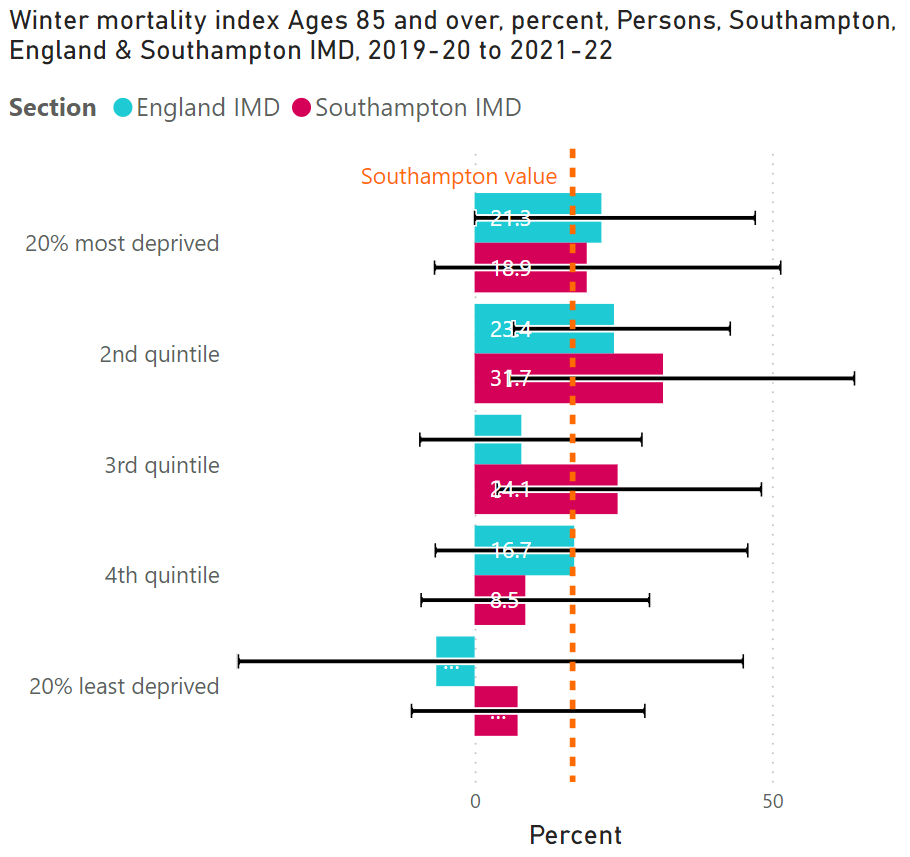 In ages 85+, looking at the data by sub-city deprivation for England quintiles, between 2019-20 to 2021-22 (3 years pooled), excess winter deaths were highest in the 2nd quintile (23.4%) and the 20% most deprived areas (21.3%). In the 20% least deprived areas the ratio was -6.5%, meaning that there were fewer deaths in the winter than in the summer. Again, similar to the findings for people of all ages, there is little evidence that there is a relationship between deprivation and winter mortality for aged 85+.
When looking at localities, the East side of the city had the highest ratio of 18.2%. Both East and West were above the Southampton average. North and Central had the lowest ratio of 14.9%, and a decrease from the previous 3 years pooled.
Resources
Life expectancy and mortality dashboard
The life expectancy and mortality dashboard present a range of data regarding life expectancy and mortality, to provide intelligence to help drive strategic decision making. Analysis includes benchmarking against statistical neighbours and trends over time for all indicators included. Some indicators include analysis at sub-city levels, by Southampton wards, primary care networks (PCNs) and deprivation quintiles.
Life expectancy and mortality dashboard
Visualisation
Mortality bubble charts
Below are two bubble charts showing all cause mortality and the number of years of life lost. In these charts the size of the bubble is proportionate to the number of deaths and years of life lost.
Mortality bubble diagram 2023
Years of life lost bubble diagram 3yrs 2021 - 2023
OHID Fingertips - Mortality profile
The Mortality Profile brings together a selection of mortality indicators, including from other OHID data tools such as the Public Health Outcomes Framework, making it easier to assess outcomes across a range of causes of death.
OHID fingertips tool - Mortality profile
Dataset
OHID – Segment tool
This tool provides information on the causes of death and age groups that are driving inequalities in life expectancy at local area level. Targeting the causes of death which contribute most to the life expectancy gap should have the biggest impact on reducing inequalities.
OHID - Life expectancy segment tool
Dataset
OHID - Excess mortality within England: post-pandemic method
Estimate of excess mortality broken down by age, sex, region, upper tier local authority, level of deprivation and cause of death using a new, post-pandemic method.
OHID - Excess mortality within England: post-pandemic method
Dataset
ONS – Winter Mortality in England and Wales
Analysis estimating excess mortality in England broken down by age, sex, region, upper tier local authority, level of deprivation and cause of death.
ONS – Winter Mortality in England and Wales
Report
ONS - Deaths broken down by age, sex, area and cause of death
Data on deaths broken down by age, sex, area and cause of death.
ONS – Deaths, broken down by age, sex, area and cause of death
Report
ONS - Child and infant mortality in England and Wales: 2021
Information on stillbirths, infant and childhood deaths occurring annually in England and Wales, and associated risk factors.
ONS - Child and infant mortality in England and Wales
Report
IHME – Global Burden of Disease (GBD)
The Global Burden of Disease (GBD) study provides a comprehensive picture of mortality and disability across countries, time, age, and sex. It quantifies health loss from hundreds of diseases, injuries, and risk factors, so that health systems can be improved and disparities eliminated.
IHME – Global Burden of Disease (GBD)
Visualisation
The impact of winter pressures on different population groups in Great Britain
Last updated: 24 September 2024