Inequality profiles
 Southampton Inequality Profiles
Inequality is defined as differences in experience or outcome between groups of people due to social, geographical, biological or other factors. These differences have a huge impact because they result in people who are worst off experiencing poorer outcomes, often resulting in reduced opportunities, poorer health and shorter lives.
One method to measure these inequalities is by analysing differences in outcomes between the 20% most deprived neighbourhoods in Southampton, compared with the 20% least deprived neighbourhoods as defined by the Index of Multiple Deprivation (IMD). For more context on inequalities and deprivation, please refer to the deprivation and poverty and health inequalities pages.
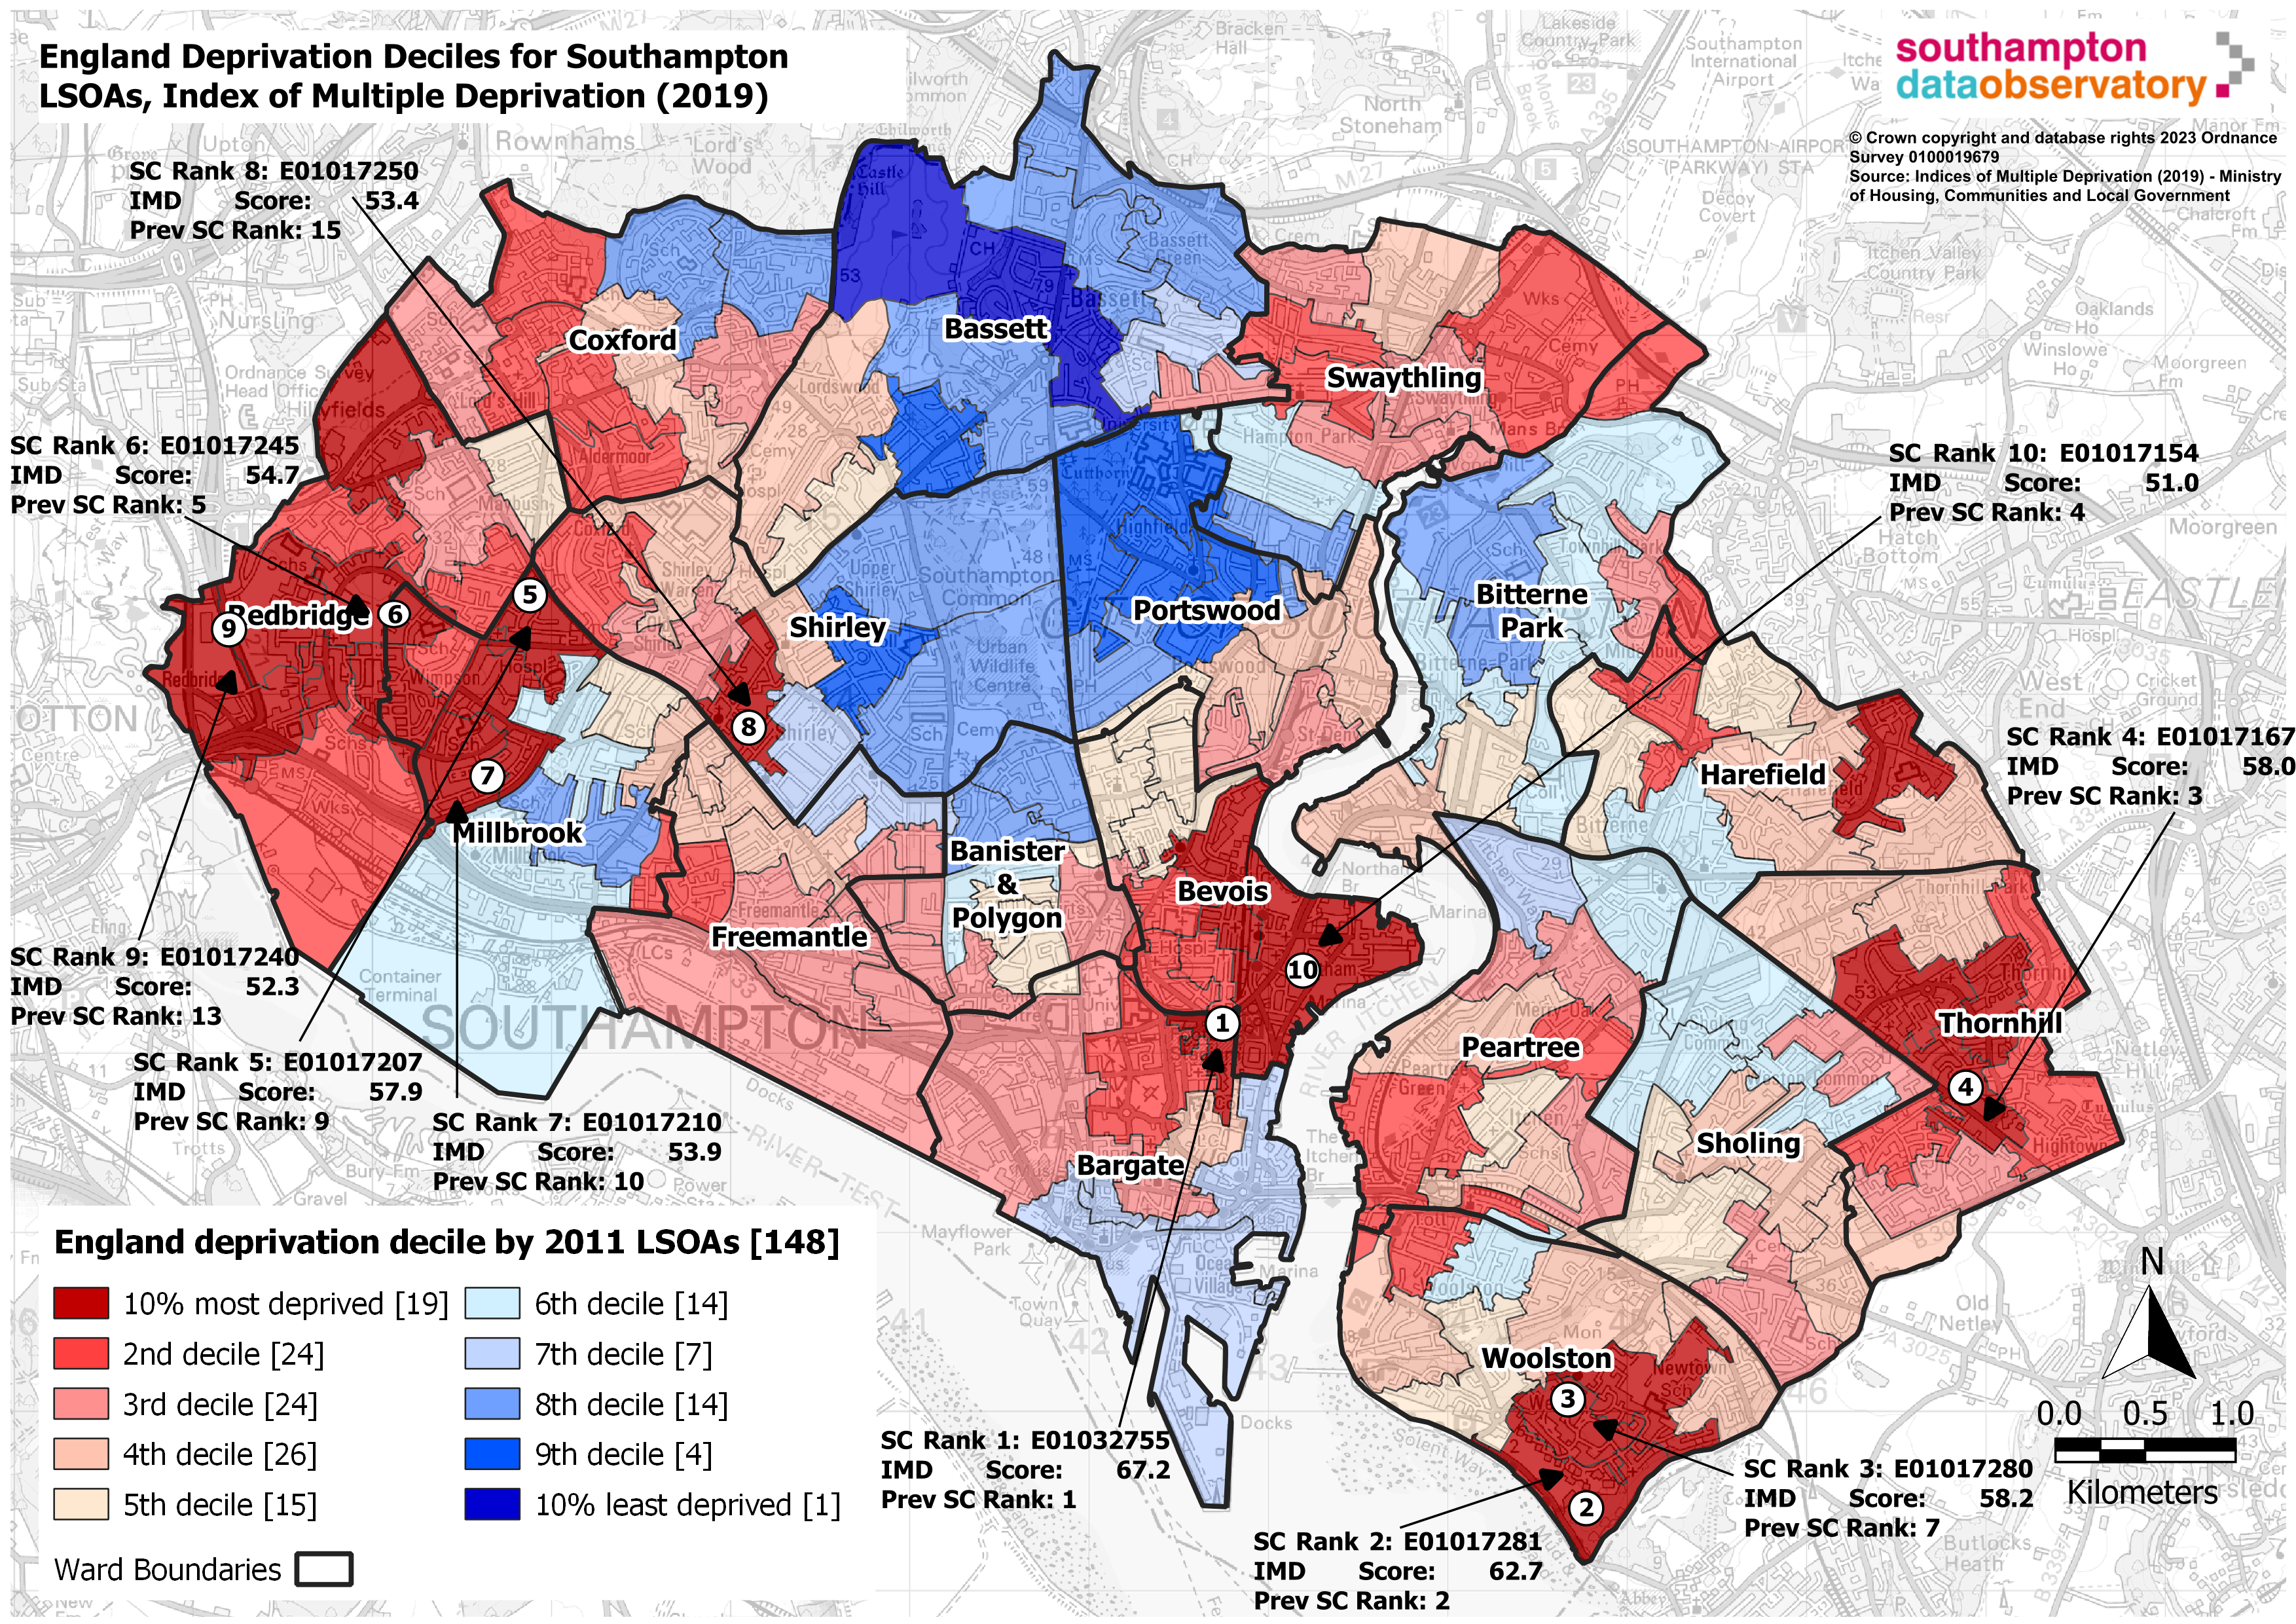 The latest IMD was released in 2019 and provides a relative ranking of deprivation for all 32,844 2011 Lower Layer Super Output Areas (LSOAs) in England. Based on this relative ranking, LSOAs can be grouped into ten equal groups, known as deciles, or five equal groups known as quintiles. Inequality profiles have been produced for England deprivation quintiles (based on the rank of Southampton LSOAs relative to all LSOAs in England), and for local Southampton deprivation quintiles (calculated from just the ranking of the 148 Southampton 2011 LSOAs). It is important to consider both national and local deprivation quintiles when monitoring inequalities. The purpose of the inequality profiles is to improve the understanding of the level of inequality across various outcomes in Southampton, as well as monitoring the gaps over time. Please note that an updated IMD is scheduled to be released in late-2025 (Oxford Consultants for Social Inclusion).
The inequality profiles can be viewed using the interactive inequality profiles Power BI report linked below. This report provides data for a range of indicators grouped into various themes, including demography, economy, community safety, health, education and social care.
Inequality profiles dashboard
Visualisation
Resources
Inequality profiles dashboard
This dashboard provides profiles for national and local deprivation quintiles in Southampton. These profiles pull together information across a range of topics including demography, economy, community safety, health, education and social care. In order to better understand the level of inequality in Southampton and whether the inequality gap is improving over time.
Inequality profiles dashboard
Visualisation
Index of Multiple Deprivation (IMD 2019) reports and data
The Department for Levelling Up, Housing & Communities (DLUHC) published the latest Indices of Deprivation (IoD) in 2019. The Indices of Deprivation (2019) provides a relative ranking of areas across the country according to their level of deprivation and is the primary source of information on deprivation in England. The IMD measures deprivation at neighbourhood level known as 2011 Lower Super Output Areas (LSOAs), which contain approximately 1,500 people, and ranks each of the 32,844 LSOAs in England by their level of deprivation and splits them into 10 equal groups known as deciles. The original IMD data produced by the DLUHC can be downloaded below along with a summary slide set. In addition, a series of maps are also available below illustrating the deprivation decile assignment for each of Southampton’s 148 LSOAs for each domain of deprivation, along with an interactive mapping tool produced by DLUHC, which allows the data for the whole of England to be explored and compared with 2015. The Southampton analysis summary slide set has been updated for 2023 ward boundaries.
IMD (2019) - Southampton analysis summary slide set
pdf | 17.4 MB | 27.06.2023
DLUHC - English indices of deprivation 2019
Dataset
IMD (2019): 2011 LSOA map of England deciles for overall IMD
IMD (2019): 2011 LSOA map of England deciles for income deprivation
IMD (2019): 2011 LSOA map of England deciles for income deprivation affecting children (IDACI)
IMD (2019): 2011 LSOA map of England deciles for income deprivation affecting older people (IDAOPI)
IMD (2019): 2011 LSOA map of England deciles for education, skills and training (EST) domain
IMD (2019): 2011 LSOA map of England deciles for EST - children and young people sub-domain
IMD (2019): 2011 LSOA map of England deciles for EST - adult skills sub-domain
IMD (2019): 2011 LSOA map of England deciles for health deprivation and disability domain
IMD (2019): 2011 LSOA map of England deciles for crime deprivation domain
IMD (2019): 2011 LSOA map of England deciles for barriers to housing and services (BHS) domain
IMD (2019): 2011 LSOA map of England deciles for BHS - geographical barriers sub-domain
IMD (2019): 2011 LSOA map of England deciles for BHS - wider barriers sub-domain
IMD (2019): 2011 LSOA map of England deciles for living environment (LE) domain
IMD (2019): 2011 LSOA map of England deciles for LE - indoor sub-domain
IMD (2019): 2011 LSOA map of England deciles for LE - outdoors sub-domain
IMD (2019): 2011 LSOA map of England deciles for employment deprivation domain
Index of Multiple Deprivation - changes between IMD 2015 and IMD 2019
Maps visualising the changes between IMD 2015 and IMD 2019 by each of Southampton's 148 2011 LSOAs with 2023 ward boundaries are available for download below. Please note that there were no changes in the EST - adult skills sub-domain between 2015 and 2019 in Southampton.
DLUHC - Indices of Deprivation: 2019 and 2015 Explorer
Visualisation
Change in overall IMD: 2015 to 2019
Change in income deprivation: 2015 to 2019
Change in income deprivation affecting children (IDACI): 2015 to 2019
Change in income deprivation affecting older people (IDAOPI): 2015 to 2019
Change in education, skills and training (EST) domain: 2015 to 2019
Change in EST - children and young people sub-domain: 2015 to 2019
Change in health deprivation and disability domain: 2015 to 2019
Change in crime domain: 2015 to 2019
Change in barriers to housing and services (BHS) domain: 2015 to 2019
Change in BHS - geographical barriers sub-domain: 2015 to 2019
Change in BHS - wider barriers sub-domain: 2015 to 2019
Change in living environment (LE) domain: 2015 to 2019
Change in LE - indoor sub-domain: 2015 to 2019
Change in LE - outdoor sub-domain: 2015 to 2019
Change in employment deprivation domain: 2015 to 2019
Geographies dashboard
This dashboard draws together a selection of interactive maps on various topics all in one place. These maps range from geographical boundary maps and points of interest for Southampton.
Geographies dashboard
Visualisation
Southampton population dashboard
The dashboard presents a range of population data to provide intelligence on Southampton's resident and GP registered population to help drive strategic decision making. Data in this dashboard is compiled from a range of publicly available sources. Including Small Area Population Forecasts (SAPF), Mid-Year Population Estimates (MYE), Subnational Population Projections (SNPP) and GP Registered Populations. Please note that SAPF figures in the dashboard are the sum of all Lower Level Super Output Areas (LSOAs) and may not be the same as other published figures.
Southampton population dashboard
Visualisation
Archived reports and data
This section contains archived content from the IMD 2015 and IMD 2010. For the latest data on deprivation in Southampton, please refer to the IMD 2019 resources above. The data underpinning the 2010 and 2015 indices are outdated and have been superseded by IMD 2019, which should be used in most instances. However, reports and data relating to IMD 2015 and IMD 2010 are provided below for comparative purposes.
IMD (2015) - Southampton analysis summary report
IMD (2015) - Southampton analysis summary slide set
pdf | 751.6 KB | 08.09.2017
DLUHC - English indices of deprivation 2015
Dataset
IMD (2010) - Southampton analysis report
IMD (2010) - Southampton analysis summary slide set
pdf | 6.0 MB | 24.05.2011
DLUHC - English indices of deprivation 2010
Dataset
Analysis of need across Southampton neighbourhoods
pdf | 27.0 MB | 31.05.2021
ONS - Subnational indicators explorer
Compare a local authority and the UK average (median) local authority by different indicators, such as weekly pay and healthy life expectancy.
ONS - Subnational indicators explorer
Visualisation
Last updated: 11 March 2024