Ward profiles
Southampton Ward Profiles
 A ward is an area within a local authority used for electoral purposes. There are 17 electoral wards in Southampton, each with three councillors (51 total).
Ward profiles have been produced for all 17 electoral wards in Southampton, to meet the need for information 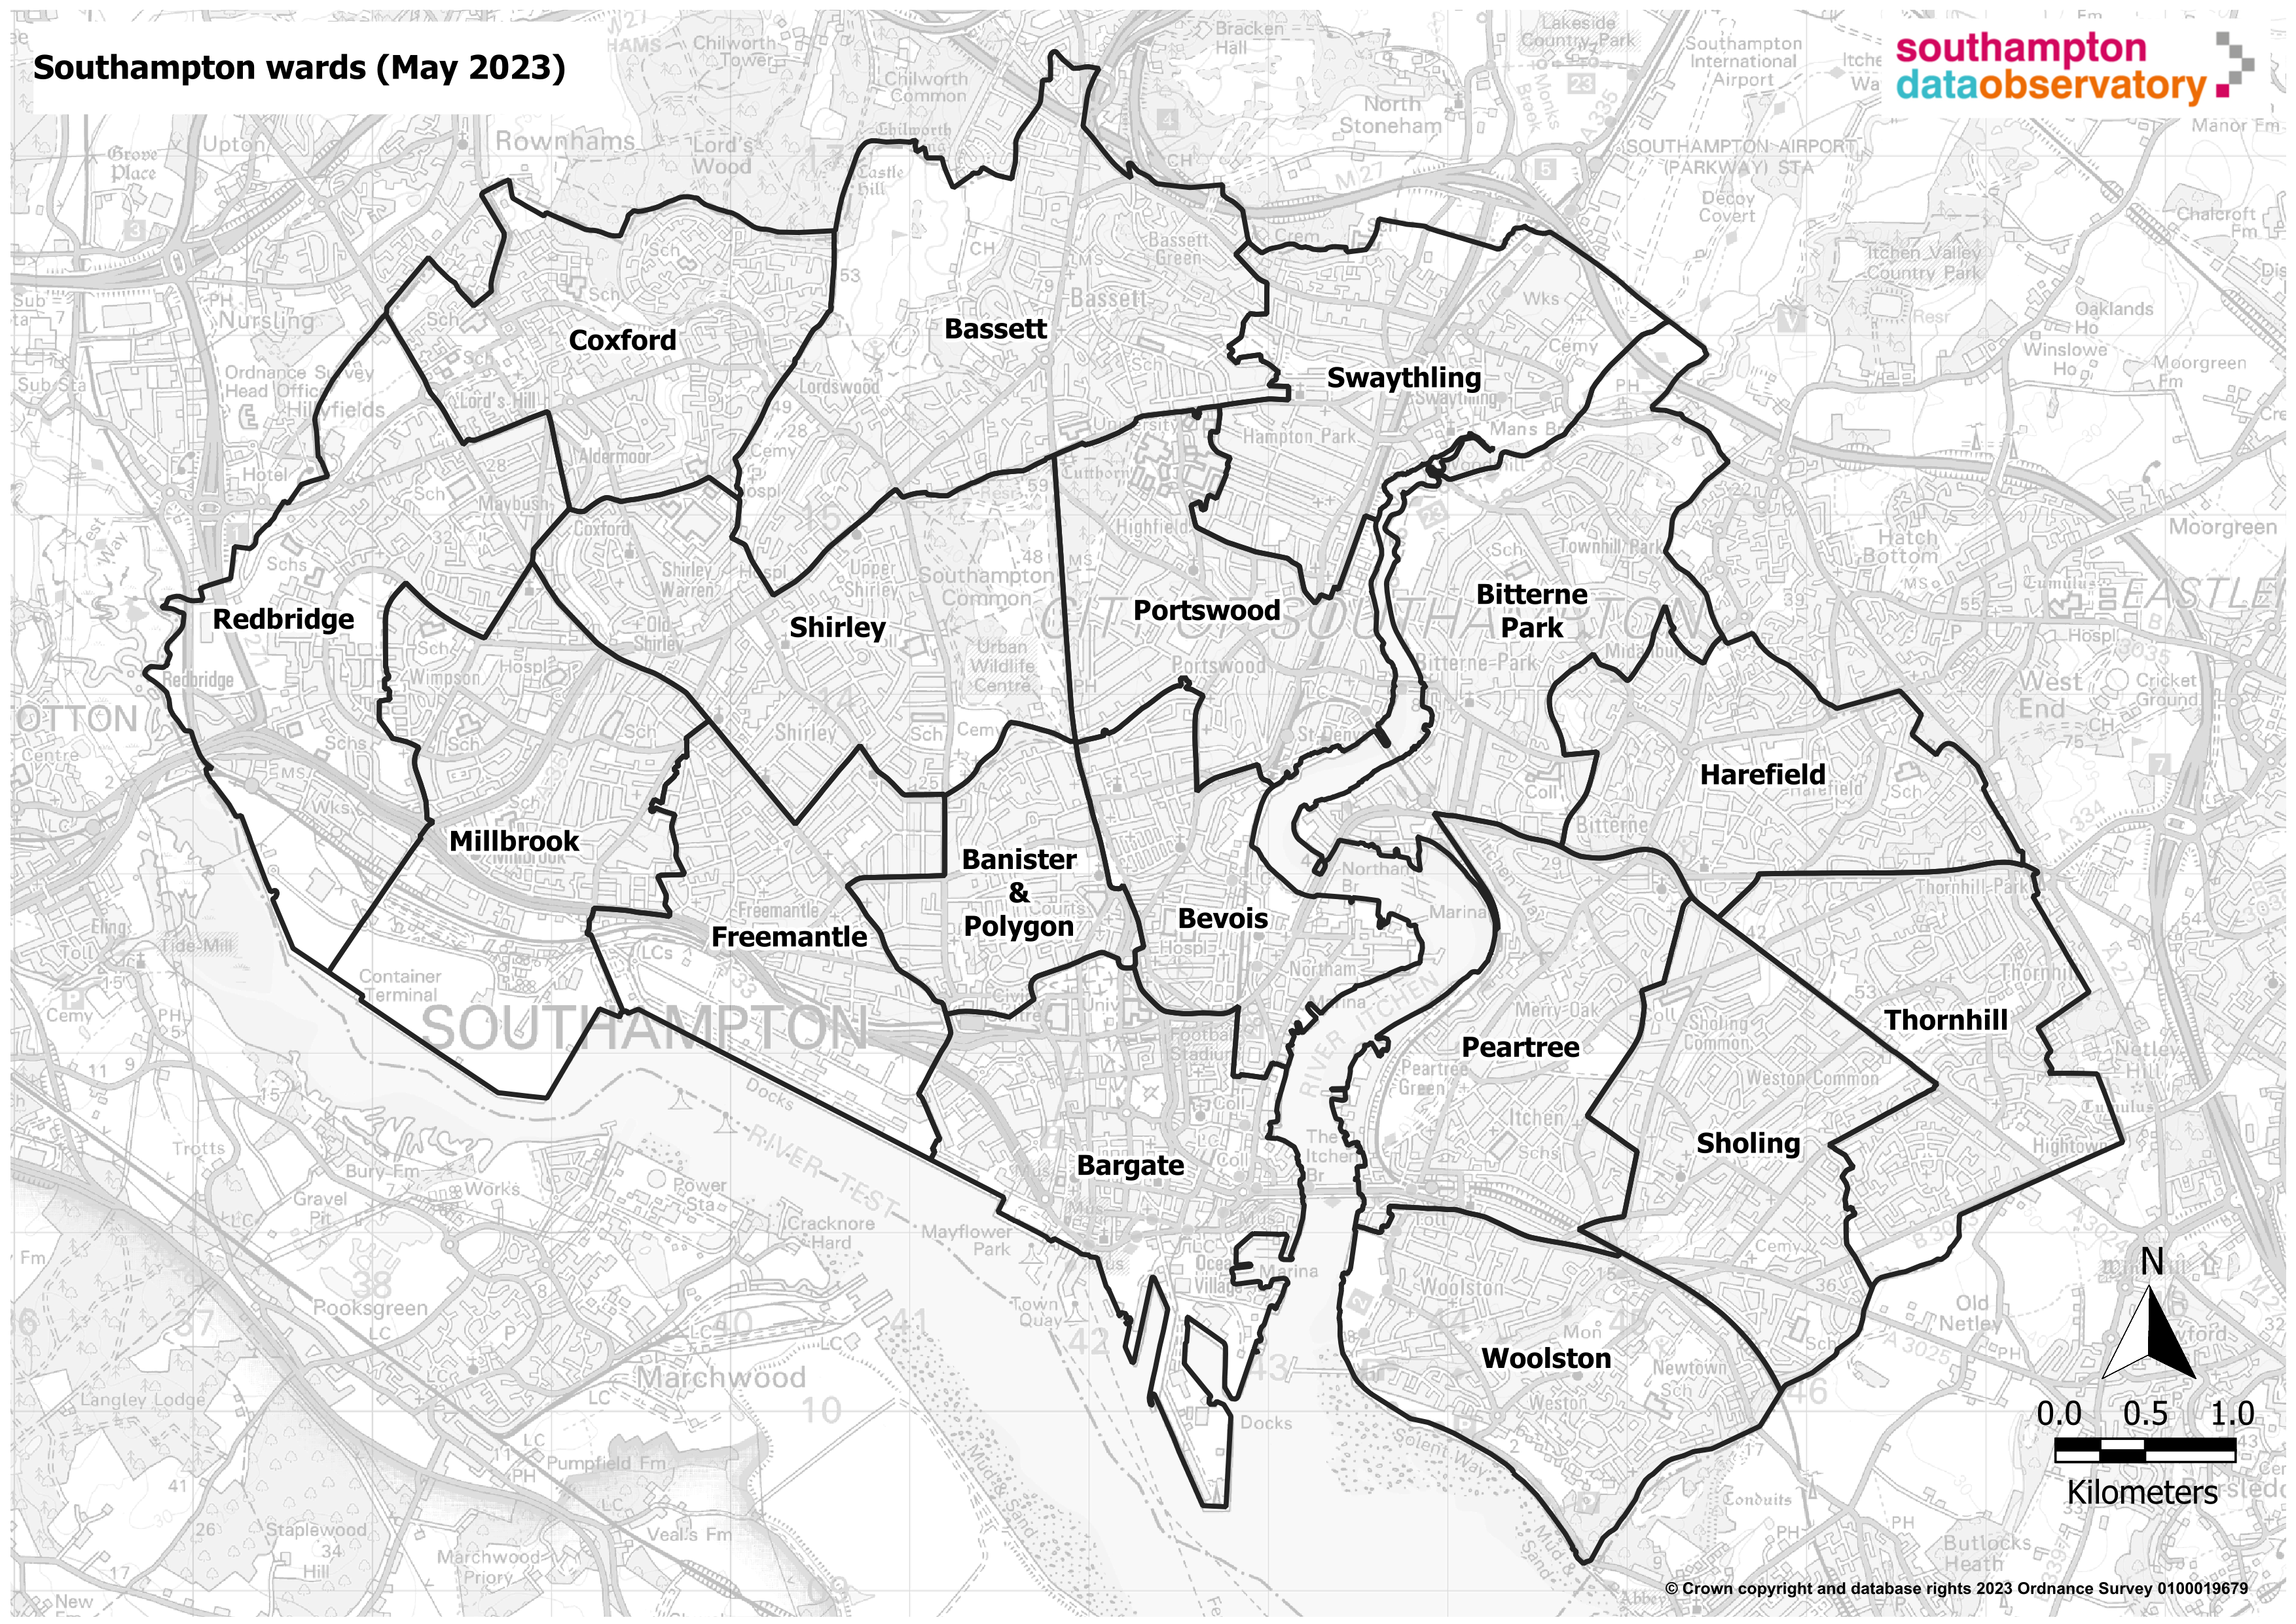 and intelligence at the local level in the city and form part of the Single Needs Assessment for Southampton. These profiles pull together information across a range of topics to better understand the local population need at sub-city geographies.
The ward profiles are part of the interactive geographical profiles Power BI dashboard linked below. This dashboard provides data for a range of indicators grouped into various topics, including demography, economy, community safety, health, education and social care.
Geographical profiles dashboard
Visualisation
Resources
Geographical profiles dashboard
This dashboard provides profiles for neighbourhoods, electoral wards and localities in Southampton. These profiles have been produced to meet the need for information and intelligence at the local level in the city and form part of the Single Needs Assessment for Southampton. These profiles pull together information across a range of topics including demography, economy, community safety, health, education and social care to better understand the local population need at sub-city geographies.
Geographical profiles dashboard
Visualisation
Geographies dashboard
This dashboard draws together a selection of interactive maps on various topics all in one place. These maps range from geographical boundary maps and points of interest for Southampton.
Geographies dashboard
Visualisation
Southampton population dashboard
The dashboard presents a range of population data to provide intelligence on Southampton's resident and GP registered population to help drive strategic decision making. Data in this dashboard is compiled from a range of publicly available sources. Including Small Area Population Forecasts (SAPF), Mid-Year Population Estimates (MYE), Subnational Population Projections (SNPP) and GP Registered Populations. Please note that SAPF figures in the dashboard are the sum of all Lower Level Super Output Areas (LSOAs) and may not be the same as other published figures.
Southampton population dashboard
Visualisation
Archived 2018 Ward Profiles
Please note that Southampton ward boundaries were reviewed in May 2023. The 2018 ward profiles are now redundant. The below Excel tool and individual infographics are available below for archive purposes. For information on current Southampton wards, please refer to the Geographical Profiles Dashboard above.
2018 Ward Profiles excel tool
Bargate 2018 Ward Profile
Bassett 2018 Ward Profile
Bevois 2018 Ward Profile
Bitterne 2018 Ward Profile
Bitterne Park 2018 Ward Profile
Coxford 2018 Ward Profile
Freemantle 2018 Ward Profile
Harefield 2018 Ward Profile
Millbrook 2018 Ward Profile
Peartree 2018 Ward Profile
Portswood 2018 Ward Profile
Redbridge 2018 Ward Profile
Shirley 2018 Ward Profile
Sholing 2018 Ward Profile
Swaythling 2018 Ward Profile
Woolston 2018 Ward Profile
ONS - Subnational indicators explorer
Compare a local authority and the UK average (median) local authority by different indicators, such as weekly pay and healthy life expectancy.
ONS - Subnational indicators explorer
Visualisation
Last updated: 29 February 2024