Births
Births overview
 Births, deaths and migration are the three factors that determine the size and makeup of a population. Monitoring birth rates and other birth related statistics help us to explain changes in Southampton’s population and make predictions about its future. Developed countries tend to have lower (and declining) birth rates due to lifestyle choices associated with economic affluence where mortality rates are low, birth control is easily accessible and children are more often seen as an economic burden. Higher education and professional careers often mean that women have children later in life. Birth rates in Southampton and England have been steadily declining, both are now significantly lower than they were in 2017.
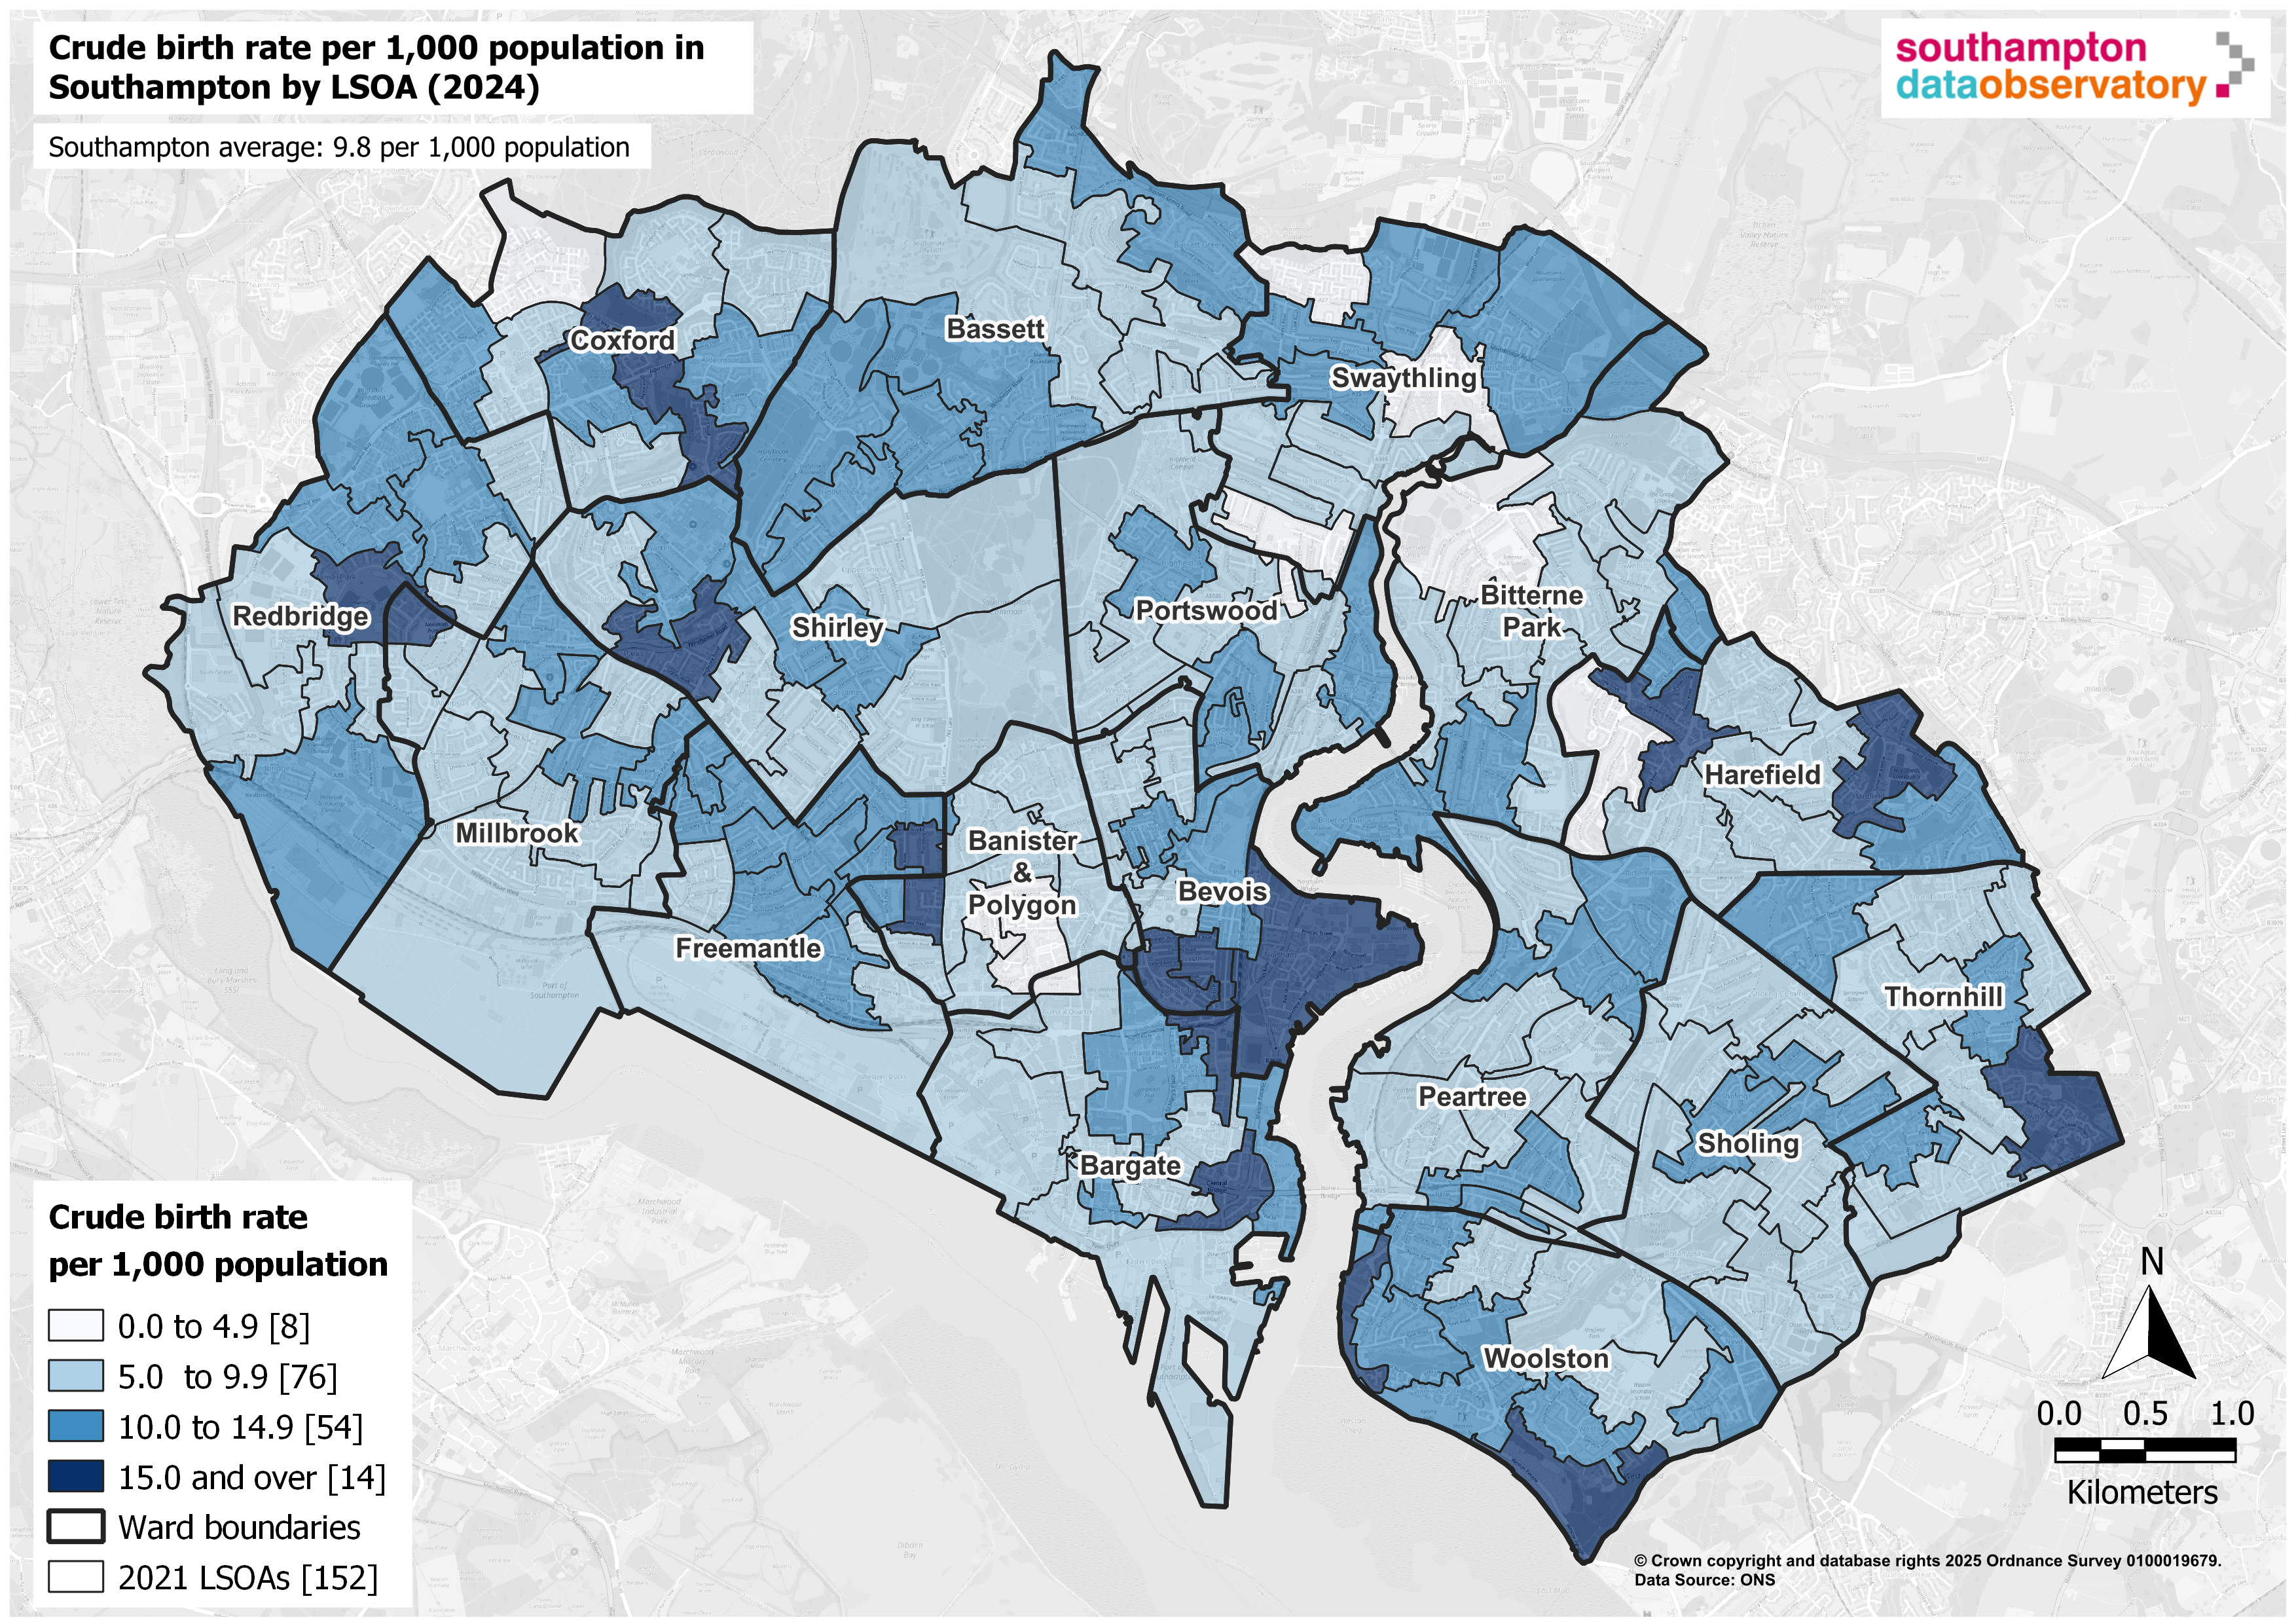 The crude birth rate is the number of births per 1,000 people of all ages, not adjusted for age or sex. The crude birth rate for Southampton is significantly higher than England, although both are falling over time. Crude rates area easily skewed by differences in an area's demographic structure. Southampton’s relatively young population means it has proportionally more women of childbearing age than England, which may explain its higher crude birth rate. Birth rates tend to be higher in areas of greater deprivation. In Southampton’s 20% most deprived areas, birth rates (11.4 per 1,000 population) are over a third higher (37%) than in the 20% least deprived (8.3 per 1,000) for 2024 (IMD2025).
The general fertility rate (GFR) is the number of live births per 1,000 female population aged 15 to 44, which adjusts for women of childbearing age in an area. Total fertility is another birth rate measure which uses general fertility rates to estimate the average number of children women would have in their lifetime. For both measures, Southampton is significantly lower than England. The general fertility rate (2022) at 44.1 per 1,000 females aged 15 to 44 years, and total fertility rate, at 1.3 children per woman are significantly lower than the England average of 51.9 and 1.5 respectively. These lower fertility rates are likely influenced by our large student population in the city, who are of childbearing age but less likely to be having children whilst undertaking studies.
Across the city, general fertility rates ranged from 18.2 in Swaythling to 62.1 in Redbridge during 2022, although year on year changes appear to fluctuate, likely reflecting differences in characteristics across the city such as deprivation and mother’s age. Unsurprisingly, areas highly populated with students in the centre of the city have both low general fertility and crude birth rates.
Despite Southampton’s declining birth rates, our total population is predicted to grow between 2025 and 2047 by 5.7% to 281,500.
More information can be found on the population section and in the dashboard below.
Births dashboard
Visualisation
Deprivation
 Health inequalities are differences in health outcomes between groups of people due to social, geographical, biological or other factors. One of the main methods of measuring health inequalities is through measuring health outcomes for each deprivation quintile. Understanding how fertility rates vary with deprivation across the city is important. Deprivation is linked to a number of infant health issues such as low birthweight, higher rates of hospital admissions, reduced breastfeeding and high smoking in pregnancy rates.
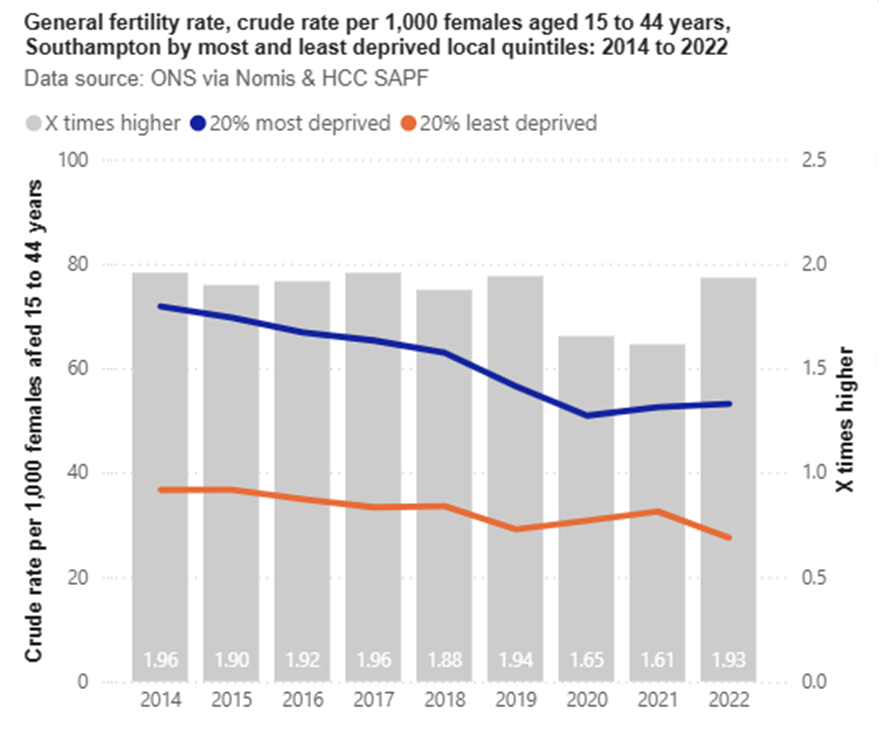
In 2022, general fertility rate analysis by deprivation quintiles (IMD2019) showed the most deprived Southampton quintile has a rate of 53.2 per 1,000 females aged 15 to 44 years, this is 1.9 times higher than the least deprived quintile (27.5 per 1,000 females aged 15 to 44 years). Between 2014 and 2022, there has been on overall decrease in the GFR in both the most and least deprived quintiles in the city. There has been a steeper consistent decrease in the GFR within the 20% most deprived quintile, compared to an overall less steep decrease (despite fluctuations) within the 20% least deprived quintile meaning the gap between the two has reduced during the time period.
More information is available in the dashboard below and in the resources section.
Births dashboard
Visualisation
Mothers’ country of birth
Understanding a mother’s background can help when designing service provision to ensure a healthier antenatal, delivery and postnatal period for both mother and child. Additionally, mothers from different countries, can have different fertility rates. Being aware of the distribution of UK born and non-UK born mothers and changes in migration can help with maternity service planning and school pupil place planning.
 It has been observed that women born outside the UK have higher total fertility rates, 2.0 for non-UK-born mothers compared to 1.5 for UK-born-mothers. The current total fertility rate of 1.6 children per woman is below the replacement rate of 2.1 (the average number of children a couple would need to have to sustain population levels without migration), which may cause longer-term economic issues.
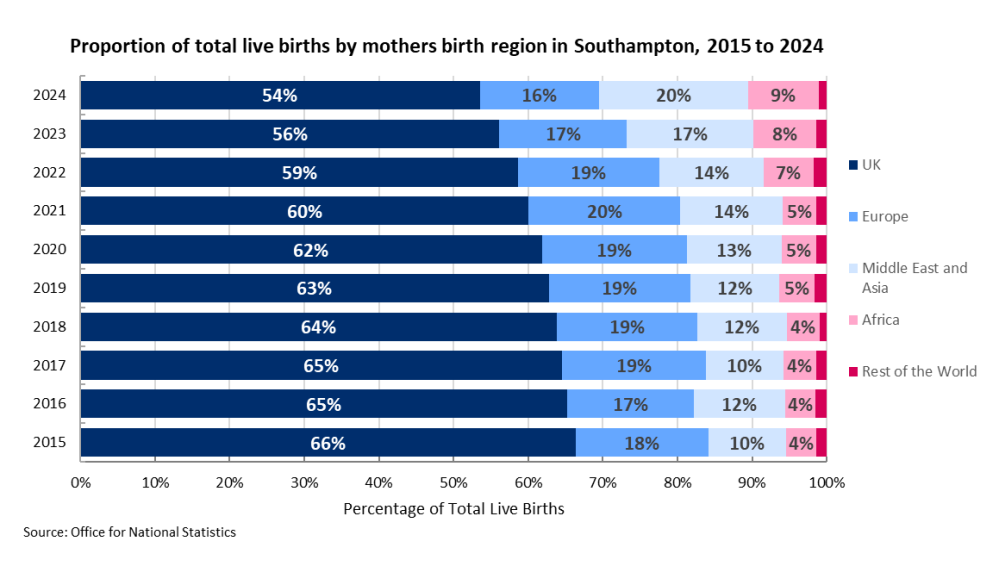
In Southampton in 2024, 46.5% of live births were born to mothers who were born outside the UK. Of the live births in Southampton, 16% were to mothers born in Europe, 20% to those born in the Middle East and Asia, 9% to mothers born in Africa and 1% were born in the rest of the world. Southampton has a higher proportion of live births born to non-UK-born mothers than its local neighbours, 38.6% in Portsmouth, 20.8% in Hampshire and 11.5% on the Isle of Wight, reflecting the diversity of Southampton’s community. The percentage for England is 34.7%.
More information can be found in the dashboard below and in the resources section.
Births dashboard
Visualisation
Age of mother
Age is the single biggest factor affecting a woman's chance to conceive and have a healthy baby. Babies born to mothers under 20 years of age face higher risks of low birthweight, preterm delivery and severe neonatal conditions. A woman's fertility starts to reduce in her early 30s, and more so after the age of 35. The risks of pregnancy complications increase as women age, including a greater risk of miscarriage, stillbirth, multiple pregnancy, cancer, needing a caesarean or assisted delivery or a child that might have learning disabilities.
Historically, Southampton has had a higher percentage of live births where the mother is aged under 18 compared to the England average. For the first time, 2020 saw Southampton’s percentage of live births to mothers under the age of 18 reach the England average of 0.6%, falling by over half from 1.5% in 2013. A larger decrease than England’s (0.5%) and the second largest decrease both compared to its local neighbours and Office for National Statistics (ONS) comparators. However, Southampton’s live births to mothers under the age of 18 increased sharply in 2021 to 1.1% (significantly higher than England 0.5%). More information on teenage conceptions is available on the sexual health page.
Contrastingly Southampton has one of the lowest rates of live births to mothers aged over 45 years at 0.2% compared to all its comparators, although this remains statistically similar to both the South East region and England averages of 0.3%. These age-related statistics are likely to reflect Southampton’s relatively young population.
More information can be found in the dashboard below and in the resources section.
Births dashboard
Visualisation
Low birthweight
Low birthweight is defined as a recorded birth weight under 2.5kgs. Low birthweight among infants is strongly associated with infant mortality, as well as disability and disease throughout child and adulthood, which can have wider impacts such as reduced educational achievement. Southampton has a statistically similar percentage of live term births with a low birthweight to the England average, 3.4% compared to 2.8%.
For the period of 2018 to 2022, the percentage of low birthweight babies across the city ranges from 1.7% in Bassett and 6.1% in Bevois. However, Bevois appears to be an outlier, with the second highest percentage at 3.9% in Woolston. It is unknown exactly why Bevois has such a high rate, it is likely the result of a combination of factors. Low birthweight is closely associated with deprivation, with babies born into the most deprived quintile are 2.2x more likely to be underweight than their counterparts born into the least deprived quintile in 2020-2022 by local IMD. Local analysis also shows Bevois has a higher concentration of Asian mothers who are more likely to have lower birth weight babies compared to the UK average. This reflects a study carried out by the University of Southampton where analysis confirms lower birth weight in second generation South Asian babies.
More information can be found in the dashboard below and in the resources section.
Births dashboard
Visualisation
Premature births
Globally, premature birth (less than 37 weeks gestation) is the leading cause of death for children under the age of 5 and can lead to other serious health issues. There is substantial evidence that smoking during pregnancy and exposure to second hand-smoke can lead to premature birth. Premature births are often analysed alongside smoking data to monitor the impact of smoking related public health interventions. While Southampton has a significantly lower rate of premature births than England in 2019-2021(70 .6 per 1,000 live births compared to 77.9), it has been steadily increasing in the city since the period 2016 to 2018. Premature births are on track to be significantly higher than England in the future if they continue to grow at the same rate.
Redbridge has the lowest rate of premature births in Southampton (48.4 per 1,000 live births) while Coxford has the highest (105.8 per 1,000 live births). Premature birth rates are linked to deprivation, the most deprived 20% areas of Southampton have a 1.4 times higher rate compared to the least deprived by local IMD (87.5 per 1,000 live births compared to 61.3).
More information can be found in the dashboard below and in the resources section.
Births dashboard
Visualisation
Smoking
Protecting an unborn baby from tobacco smoke is one of the best ways to give a child a healthy start in life. Smoking when pregnant increases the risk of complications in pregnancy and birth such as stillbirth, premature birth, miscarriages, low birth weight and sudden infant death syndrome (NHS 2023).
7.9% of pregnant women in Southampton are smoking at the time of delivery. This percentage gives Southampton the 9th highest prevalence amongst its comparators and is statistically similar to England (7.4%). Southampton has historically been significantly higher than England until 2020/21 where Southampton made a significant decrease and continues to do so. Looking at 2023 ward level, in 2018/19 to 2020/21 pooled, Thornhill (which is one of the more deprived areas) had the highest prevalence of smoking at delivery with a rate of 22.7% while Bassett (one of the least deprived areas) had the lowest rate of 4.4%.
More information can be found on the smoking page and in the resources section.
Resources
Births interactive dashboard
The births dashboard presents a range of data regarding births, to provide intelligence to help drive strategic decision making. Analysis includes benchmarking against statistical neighbours and trends over time for all indicators included. Some indicators include analysis at sub-city levels, by Southampton wards and by national or local deprivation quintiles.
Births dashboard
Visualisation
Population interactive dashboard
The dashboard presents a range of population data to provide intelligence on Southampton's resident and GP registered population to help drive strategic decision making. Data in this dashboard is compiled from a range of publicly available sources. Including Small Area Population Forecasts (SAPF), Mid-Year Population Estimates (MYE), Subnational Population Projections (SNPP) and GP Registered Populations. Please note that SAPF figures in the dashboard are the sum of all Lower Level Super Output Areas (LSOA) and may not be the same as other published figures.
Southampton population dashboard
Visualisation
ONS - Births by parents’ country of birth, England and Wales: 2023
OHID Fingertips - Child and Maternal Health
This profile brings together a range of publicly available data, information, reports, tools and resources on child and maternal health into one easily accessible hub. It helps you find and use the information and evidence you need to improve decision making as part of your planning or commissioning process.
OHID – Child and maternal health profile
Dataset
Journal of Epidemiology and Community Health (via BMJ Journals) - Persistence of lower birth weight in second generation South Asian babies born in the United Kingdom
This research report looked at the differences in birth weight between all first and second generation South Asian babies born in Southampton, and trends between 1957 and 1996.
Journal of Epidemiology and Community Health (via BMJ Journals) - Persistence of lower birth weight in second generation South Asian babies born in the United Kingdom
Report
Last updated: 22 January 2026