Domestic abuse
 Domestic abuse
Domestic abuse not only has an impact on victims, but also close family and children in the household. Children related to or under parental responsibility of either the victim or perpetrator of domestic abuse are recognised as victims in their own right under the Domestic Abuse Act. Children experiencing or witnessing domestic abuse is a key adverse childhood experience (ACE), with children having ACEs more likely to have poorer outcomes; particularly those relating to health, education and crime. The impact on children is illustrated by the fact that 63% of MARAC (Multi Agency Risk Assessment Conference, previously High-Risk Domestic Abuse – HRDA) cases in Southampton have children or young people in the household (2024/25).
 As part of the Domestic Abuse Act, a statutory definition for domestic abuse was created, which emphasises that domestic abuse is more than just physical abuse and includes the following:
- Physical or sexual abuse;
- Violent or threatening behaviour;
- Controlling or coercive behaviour;
- Economic abuse;
- Psychological, emotional or other abuse
It is difficult to understand the overall picture of domestic abuse, as it is frequently a hidden crime with very high levels of under-reporting. Therefore, it is difficult to say whether observed changes reflect a ‘true’ change, especially because police recorded figures of domestic abuse are likely to have been impacted by policing activity, public reporting of crime and changes to the counting rules.
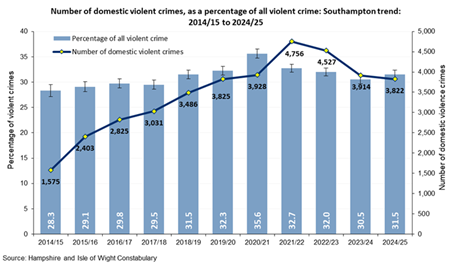
 There were 4,942 domestic flagged crimes in Southampton during 2024/25, a negligible decline (-0.3%) from 2023/24. Domestic flagged crime accounted for 15.9% of all recorded crimes in Southampton in 2024/25, a similar proportion compared to the previous year (15.2% in 2023/24). Domestic violence continues to be a key driver of violent crime in Southampton, with 31.5% of violent crimes flagged as domestic in the most recent year.
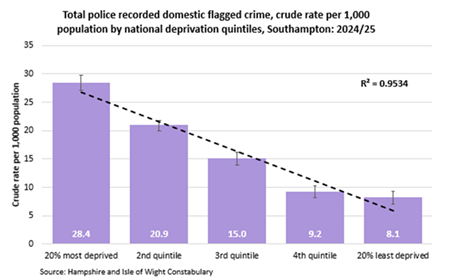
Although anyone can experience domestic abuse, there is a very strong link between deprivation and domestic flagged crime in Southampton. The rate of domestic flagged crime is 3.5 times higher in the 20% most deprived neighbourhoods in the city compared to rates for the 20% least deprived areas.
A summary report and slide set produced as part of the 2024/25 Strategic Assessment are available to download below. The interactive community safety dashboard can be accessed using the link below. For more information on crime in Southampton, see the Safe City Strategic Assessment page.
Resources
2024/25 Safe City Strategic Assessment
The Southampton Safe City Strategic Assessment provides an overview of current and future crime, disorder and community safety issues affecting Southampton and makes recommendations to enable the Partnership to focus the Safe City Strategy and local delivery plans. The report and slide set that informed the assessment are available below to download. The interactive community safety dashboard can be accessed using the link below.
Geographical profiles dashboard
This dashboard provides profiles for neighbourhoods, electoral wards and localities in Southampton. These profiles have been produced to meet the need for information and intelligence at the local level in the city and form part of the Single Needs Assessment for Southampton. These profiles pull together information across a range of topics including demography, economy, community safety, health, education and social care to better understand the local population need at sub-city geographies.
Archived assessments
This section contains archived reports from previous Safe City Strategic Assessments. For the latest report and data on crime and community safety in the city, see the Safe City Strategic Assessment above.
2022 Violence Against Women and Girls Problem Profile
A Violence Against Women and Girls (VAWG) Problem Profile was undertaken to explore the extent of VAWG in Southampton and to understand key patterns.
Last updated: 05 January 2026