Deprivation and poverty
 Deprivation and poverty in Southampton
The COVID-19 pandemic, the Cost of Living Crisis and the war in Ukraine have been key factors challenging the economic situation of the UK over the last five years. The city’s characteristics relating to poverty and deprivation continue to present challenges more in common with other urban areas across the country with high levels of deprivation.
Poverty refers to not having enough income to cover financial needs, while deprivation goes beyond just lacking money it means missing out on various resources or opportunities as well.
 The Index of Multiple Deprivation (IMD 2025) illustrates how Southampton continues to be a relatively deprived city. Based on average deprivation rank of its neighbourhoods (LSOAs), Southampton is now ranked 76th (where 1 is the most deprived) out of 296 local authorities; less deprived than the comparator cities of Bristol (123rd), Portsmouth (73rd) and Sheffield (90th). Southampton has 18 LSOAs within the 10% most deprived in England and six in the 10% least deprived. More information on the Indices of Multiple Deprivation can be found in the section below.
Claimant count data is published monthly and allows for the proportion of adults claiming out of work benefits to be monitored in detail. In Southampton number of adults claiming out of work benefits has decreased over the last year. As of January 2026, 4.2% (7,435) of the working age population (aged 16 to 64) were claiming out of work benefits in Southampton; a decrease of -75 claimants (-1.0%) since January 2025 (4.2%).
In 2025, the median weekly gross earnings for a full-time employee, resident in Southampton was estimated to be £724, which is below the England average of £770 . In addition, those working in the city earn more than those resident in city (£57 per week gap for full time workers), suggesting the best paid jobs in Southampton are being undertaken by workers commuting into the city. More information on wages, employment and Southampton’s economy can be found in the Southampton Economic Assessment.
Deprivation and inequalities between residents and neighbourhoods in Southampton are significant and continue to be a driver for crime and poor health outcomes in Southampton. In addition, key outcomes for children and young people in Southampton continue to be poorer than the England average, with outcomes significantly poorer (and starting earlier in life) for those residents living in the most deprived areas of the city compared to those living in the least deprived areas. More information on the variation in outcomes for Southampton residents can be found in the health inequalities page.
Index of Multiple Deprivation (IMD)
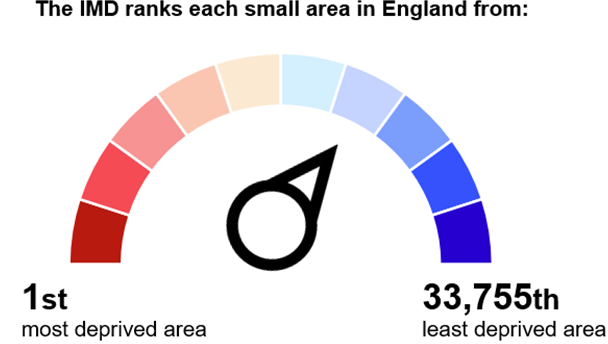 The Ministry of Housing, Communities and Local Government (MHCLG) published the latest Indices of Deprivation (IoD) in October 2025. The Index of Multiple Deprivation (IMD 2025) provides a relative ranking of areas across the country according to their level of deprivation and is the primary source of information on deprivation in England. The IMD measures deprivation at neighbourhood level known as Lower Layer Super Output Areas (LSOAs), which contain approximately 1,500 people. Each of the 33,755 LSOAs in England is ranked by their level of deprivation and is then split into 10 equal groups known as deciles.
The IMD (2025) is based on the concept that deprivation consists of more than just poverty. Poverty is not having enough money to get by on, while deprivation refers to a general lack of resources and opportunities. The IMD brings together a range of indicators, which cover specific aspects of deprivation. These indicators are aggregated into seven domains, which are then weighted and combined to create the overall IMD. The majority of the data underpinning the IMD 2025 is from 2021/22, although some is more recent.
The 7 domains are:
- Income domain
- Employment domain
- education skills & training domain
- Health and disability domain
- Crime domain
- Barriers to housing & services
- Living environment domain
In addition, the income domain also has two supplementary indices:
- Income deprivation affecting children (IDACI)
- Income deprivation affecting older people (IDAOPI)
In the IMD 2025 many of the indicators in the domains have been modified or changed. For more information see the slide set below.
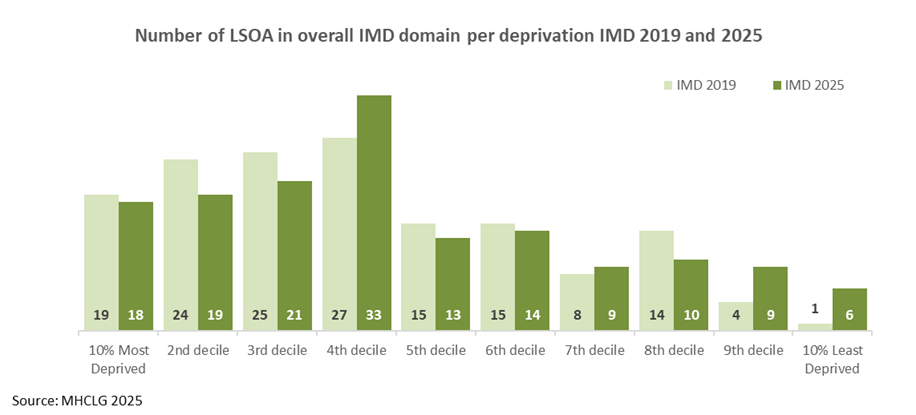
![]() Overall, there has been some change in relative deprivation levels in Southampton compared to other local authorities, in England since the last IMD in 2019, with the Southampton remaining a relatively deprived city. A summary of the main findings from the IMD (2025) are outlined below:
Overall, there has been some change in relative deprivation levels in Southampton compared to other local authorities, in England since the last IMD in 2019, with the Southampton remaining a relatively deprived city. A summary of the main findings from the IMD (2025) are outlined below:
- Of the 296 Local Authorities in England, Southampton is ranked 76th (previously 55th) most deprived based on average rank of LSOAs
- In the IMD 2025 there are 152 LSOAs compared to 148 LSOAs in IMD 2019
- Southampton has 18 LSOAs within the 10% most deprived in England (one less than in 2019) and six LSOA in the 10% least deprived in England (previously one in 2019)
- Looking at population and population change by decile, 2025 had -8,965 fewer Southampton residents living in the two most deprived deciles (20% the most deprived neighbourhoods)
- Almost a quarter (24.6%) of Southampton’s population is classified as living within the two most deprived deciles (20% most deprived neighbourhoods nationally) (62,077 people). By age group, 29.0% of under 16s and 22.3% of 60+ live in the 20% most deprived neighbourhoods
- At the other end of the scale, an extra +15,594 people are now in two least deprived deciles nationally – previously in 2019 this was 9,159 people
- 11.7% of Southampton’s population live in the 10% most deprived areas nationally, this rises to 15.3% for under 16s, suggesting deprivation has a disproportionate impact on young people in the city
- In 2025, 58 LSOA were in the most deprived 30% nationally, compared to 68 in 2019, suggesting a more uniform shift in relative deprivation in Southampton
- 15 LSOA were in the IMD 2025 20% least deprived (deciles 9 and 10), three times more than the 5 LSOA for IMD 2019
- The five most deprived neighbourhoods in Southampton, in order are in Weston (Kingsclere Avenue), Bargate (Golden Grove), Thornhill (Lydgate Road), Thornhill (Hinkler Road) and Thornhill (Upper Deacon Road).
- Southampton is ranked in the 1st decile (10% most deprived) for Crime, 2nd decile for Health Deprivation & Disability and for both IDACI and IDOPI, 3rd decile for Income and Education, Skills & Training, 4th decile for Employment and Living Environment and 9th decile for Barriers to Housing & Services
- Southampton’s relative rank shows the highest level of deprivation for the Crime domain where it ranks the 5th worse across all LAs and is in the 10% most deprived decile Southampton’s relative rank shows the lowest level of deprivation for Barriers to Housing & Services where it ranks 252nd across all local authorities and in the 9th decile
Southampton’s positive rank change in overall IMD ranking is primarily driven by positive changes in ranking for Barriers to Housing & Services, Living Environment and Crime domains, which are the domains with substantial methodology changes between 2019 and 2025 IMD, so change analysis between the indices are less directly comparable to previous indices.
More information on deprivation in Southampton can be found in a summary slide set, data compendium and series of maps for each deprivation domain, which can be downloaded from the resources section at the bottom of the page. In addition, the IMD 2025 data can also be visualised in an interactive map format using the Local Deprivation Explorer produced by MHCLG below.
IMD 2025 dashboard
Visualisation
MHCLG - Local Deprivation Explorer 2025
Website
Deprivation and health
The relationship between deprivation and health is well documented (Marmot, 2010). The report, how does money influence health from the Joseph Rowntree Foundation (JFR) identified four main ways in which income in particular affects people’s wellbeing:
- Material: Money buys goods and services that improve health. The more money families have, the better the goods they can buy
- Psychosocial: Managing on a low income is stressful. Comparing oneself to others and feeling at the bottom of the social ladder can be distressing, which can lead to biochemical changes in the body, eventually causing ill health
- Behavioural: For various reasons, people on low incomes are more likely to adopt unhealthy behaviours (smoking and drinking, for example), while those on higher incomes are more able to afford healthier lifestyles
- Reverse causation (poor health leads to low income): Health may affect income by preventing people from taking paid employment. Childhood health may also affect educational outcomes, limiting job opportunities and potential earnings
There are significant health inequalities in Southampton, with those living in the most deprived areas of the city having poorer health outcomes compared to those living in the least deprived areas. For example, between 2019-2021, males living in the most deprived areas (IMD 2019) of the city on average live 6.6 years less than those living in the least deprived areas, whilst females live 2.6 years less on average. More information on the variation in health outcomes for Southampton residents can be found on the health inequalities page.
Child poverty
The Marmot Review (2010) suggests there is evidence to show that childhood poverty leads to premature mortality and poor health outcomes for adults. There is also a wide variety of evidence to show, that children who live in poverty are exposed to a range of risks that can have a serious impact on their mental health. Reducing the numbers of children who experience poverty should improve these adult health outcomes and increase healthy life expectancy.
In 2023/24 data from the DWP, 24.7% of children aged 0 to 15 were living in relative low-income families, significantly higher than the England average (22.0%). Where relative low-income is defined as a family whose equivalised income is below 60 per cent of contemporary median income. Gross income measure is before Housing Costs (BHC) and includes contributions from earnings, state support and pensions.
![]() The IMD 2025 includes a supplementary index of Income Deprivation Affecting Children Index (IDACI). The IDACI measures the proportion of children in each neighbourhood (LSOA) that live in families that are income deprived (i.e. in receipt of Income Support, income-based Jobseeker’s Allowance, Pension Credit (Guarantee) or Child Tax Credit below a given threshold). This shows that there is significant variation across the city, with the proportion of children who are income deprived ranging from around 6% (LSOAs in Portswood, Shirley and Bassett) to over 75% (LSOAs in Bevois, Thornhill and Redbridge). The deprivation domain maps can be downloaded from the resources section below.
The IMD 2025 includes a supplementary index of Income Deprivation Affecting Children Index (IDACI). The IDACI measures the proportion of children in each neighbourhood (LSOA) that live in families that are income deprived (i.e. in receipt of Income Support, income-based Jobseeker’s Allowance, Pension Credit (Guarantee) or Child Tax Credit below a given threshold). This shows that there is significant variation across the city, with the proportion of children who are income deprived ranging from around 6% (LSOAs in Portswood, Shirley and Bassett) to over 75% (LSOAs in Bevois, Thornhill and Redbridge). The deprivation domain maps can be downloaded from the resources section below.
Children living in poverty and deprivation are more likely to have poorer outcomes in adulthood, particularly those relating to health, education, employment and crime. It has also been found that children and families from the poorest 20% of household incomes are three times more likely to have common mental health problems than those in the richest 20%.
The latest data on those pupils who are eligible for free school meals from Department for Education (DfE) (2024/25), shows that 37.9% of all pupils, in state funded schools in Southampton, were known to be eligible for free school meals, which is significantly higher than the national average (25.7%).
Local comparator and trend data on free school meals and other child poverty indicators can be explored further using the Office for Health Improvement and Disparities (OHID) fingertips tool below.
OHID Fingertips - Child poverty indicators
Website
Fuel poverty
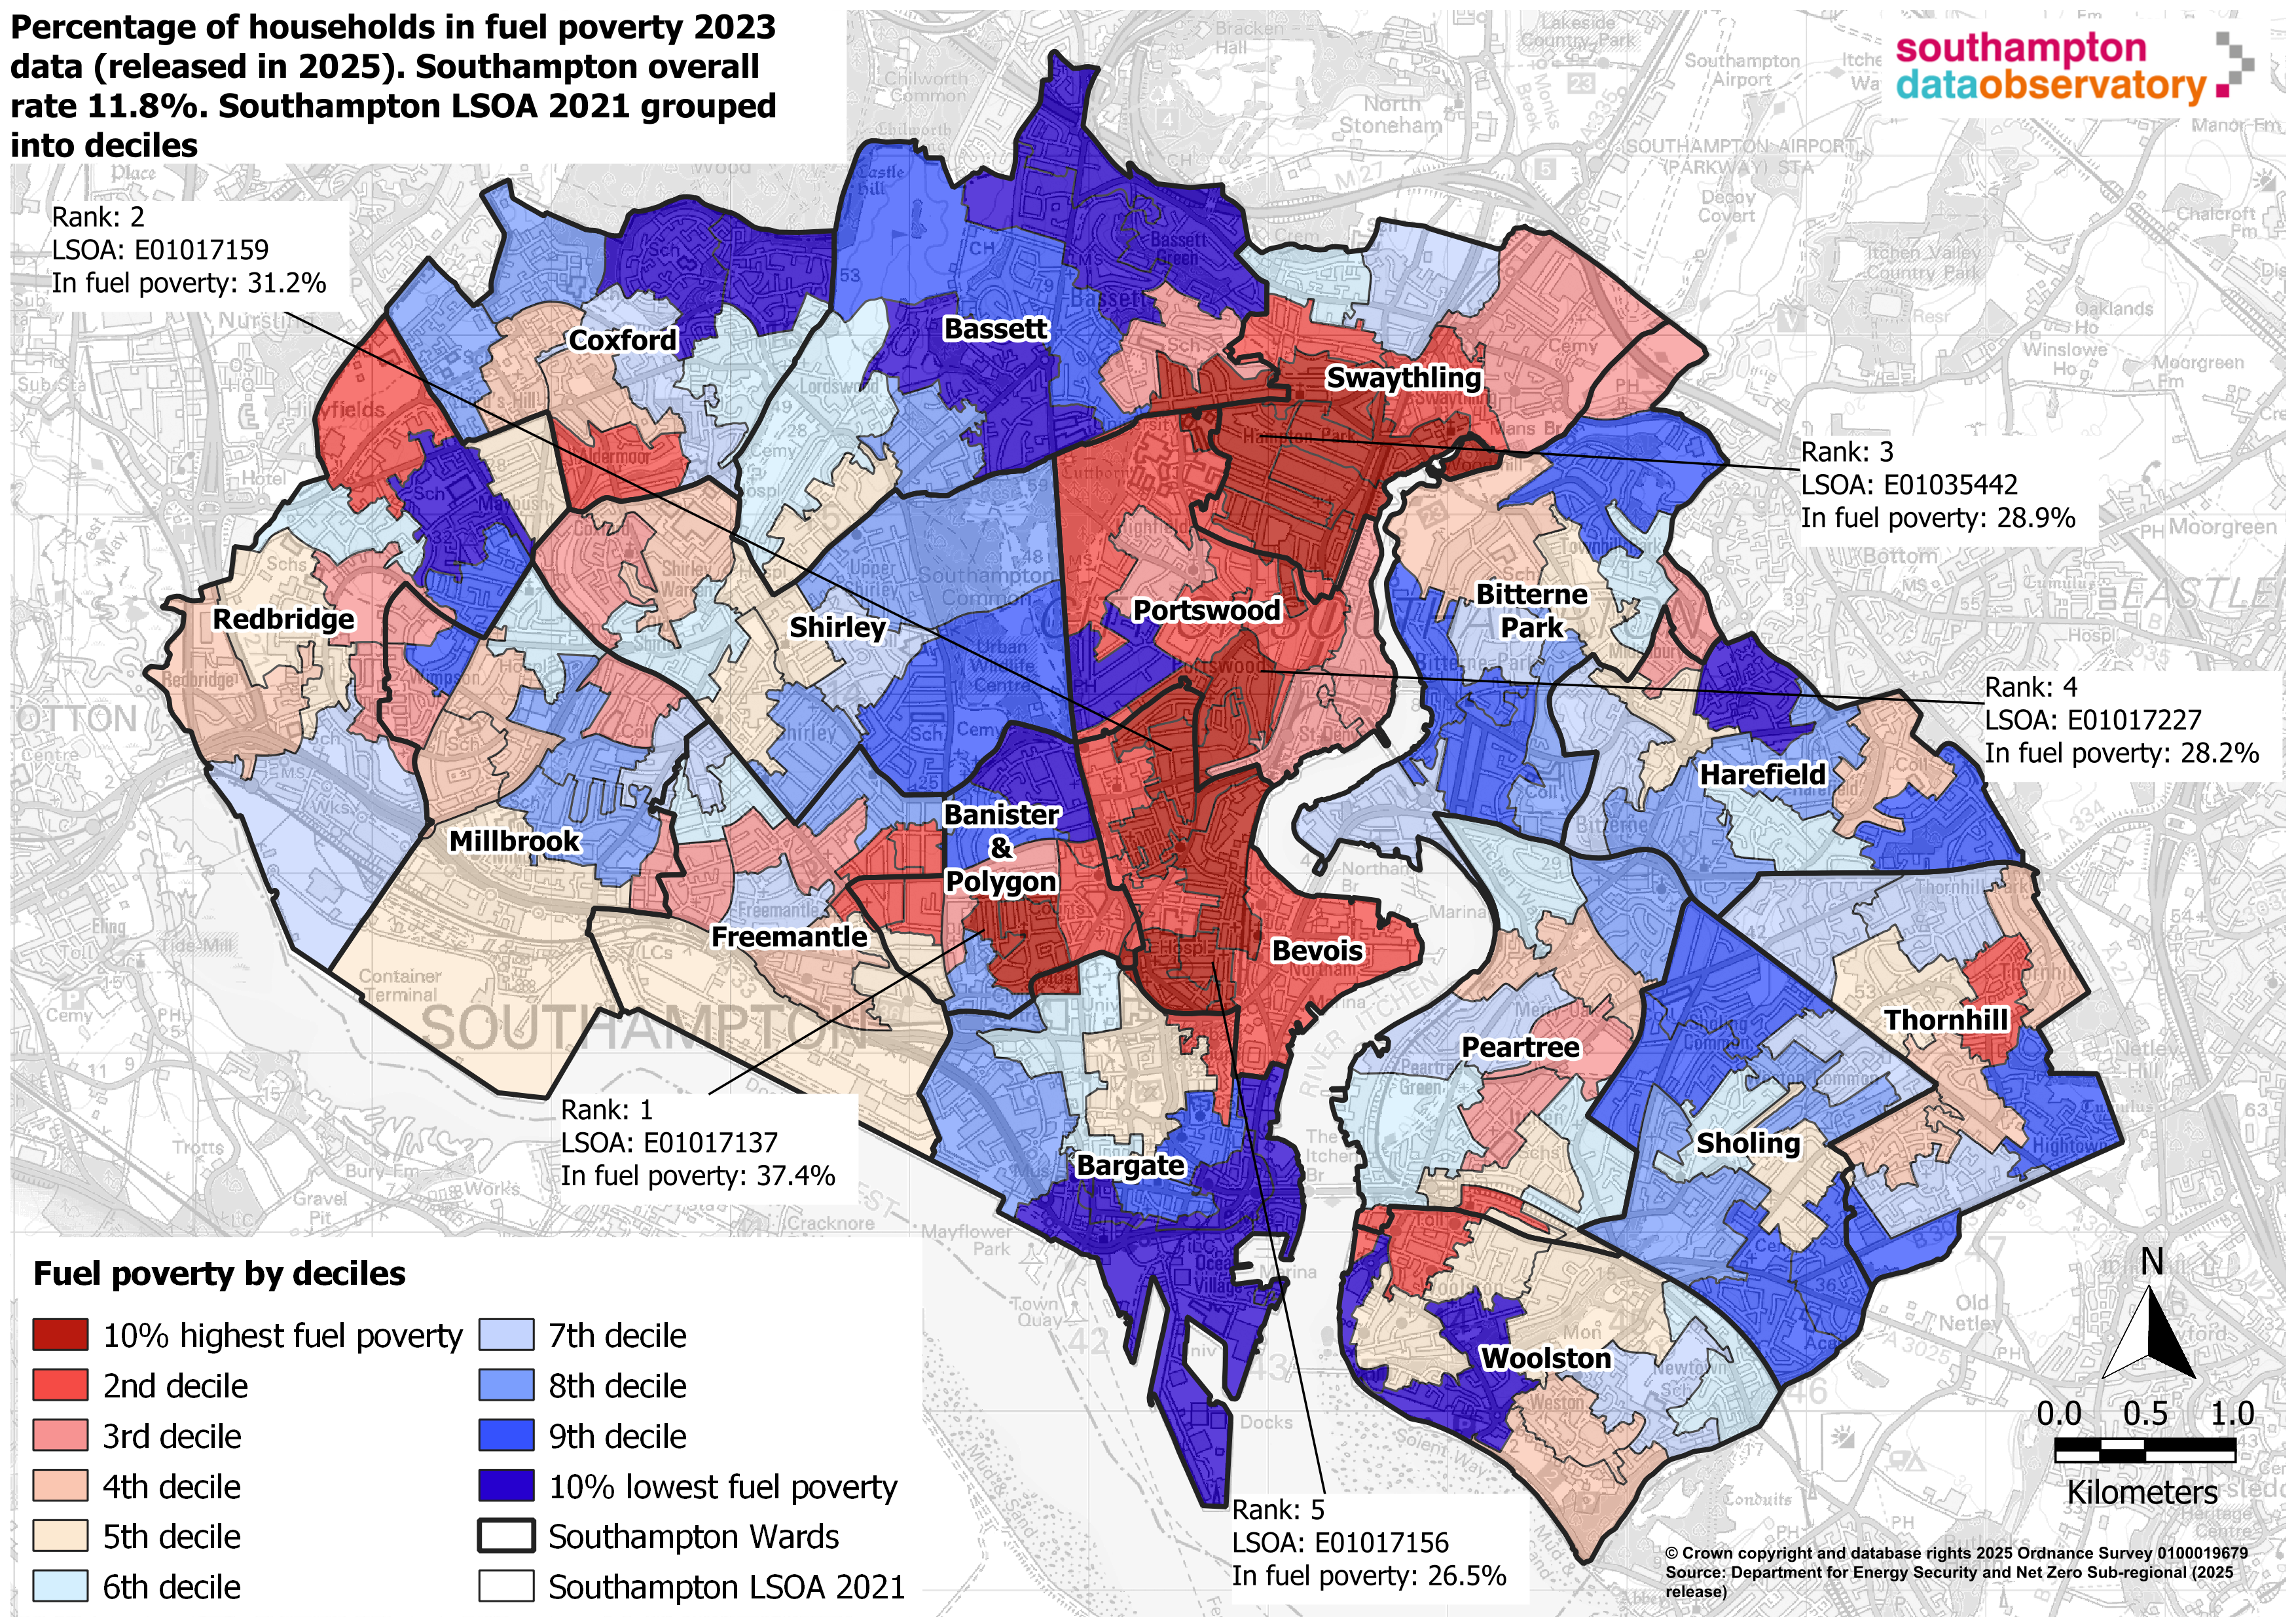 In 2023, figures showed that 11.0% of households in England (2.7 million households) were living in fuel poverty. The proportion living in fuel poverty in Southampton is slightly higher at 11.8%, equating to about 12,700 households in the city. In comparison, the proportion in Hampshire is just 8.4%. This is based on the Low Income Low Energy Efficiency (LILEE) definition, where a fuel poor household is one in which has a fuel poverty energy efficiency rating (FPEER) of band D or below and were to spend their modelled energy costs, they would be left with a residual income below the official poverty line.
There has been a fall in the number of households in fuel poverty between 2020 and 2023. In Southampton, the decrease is approximately 700 households or -0.7 percentage points. In comparison, the England figure has also fallen by 2.2 percentage points 400,000 households over the same period. As shown by the map, levels of fuel poverty vary considerably across Southampton.
Resources
Index of Multiple Deprivation (IMD 2025)
The Ministry of Housing, Communities and Local Government (MHCLG) published the latest Indices of Deprivation (IoD) in October 2025. The Indices of Deprivation 2025 provides a relative ranking of areas across the country according to their level of deprivation and is the primary source of information on deprivation in England. The IMD measures deprivation at neighbourhood level known as 2021 Lower Super Output Areas (LSOAs), which contain approximately 1,500 people. In addition, a series of maps are available below illustrating the deprivation decile assignment for each of Southampton’s 152 LSOAs for each domain of deprivation. Southampton is ranked 76th (previously 55th in IMD 2019) most deprived based on average rank of LSOAs across 296 local authorities.
IMD2025 - Summary 2019 to 2025
pdf | 9.1 MB | 31.03.2026
IMD2025 - Analysis 2019-2025
pdf | 11.7 MB | 31.03.2026
IMD 2025 dashboard
This dashboard presents and in depth analysis of the Index of Multiple Deprivation data by two geographies LSOA neighbourhoods and lower tier local authorities.
IMD 2025 dashboard
Visualisation
Index of Multiple Deprivation (IMD 2025) - maps
Maps of the domains from the IMD 2025.
IMD2025 Overall domain deciles
IMD2025 Income domain deciles
IMD2025 Income Deprivation Affecting Children Index (IDACI) deciles
IMD2025 Income Deprivation Affecting Older People (IDAOPI) deciles
IMD2025 Employment domain deciles
IMD2025 Education, Skills & Training domain deciles
IMD2025 Education, Skills & Training sub-domain Children & Young People deciles
IMD2025 Education, Skills & Training sub-domain Adult Skills deciles
IMD2025 Health Deprivation & Disability domain deciles
IMD2025 Crime domain deciles
IMD2025 Barriers to Housing & Services domain deciles
IMD2025 Barriers to Housing & Services sub-domain Geographical Barriers deciles
IMD2025 Barriers to Housing & Services sub-domain Wider Barriers deciles
IMD2025 Living Environment domain deciles
IMD2025 Living Environment sub-domain Indoors deciles
IMD2025 Living Environment sub-domain outdoors deciles
The Ministry of Housing, Communities and Local Government (MHCLG) - IMD 2025 statistical release
Information from the MHCLG on the English Indices of Deprivation (IoD25) which measures relative levels of deprivation in 33,755 small areas or neighbourhoods, called Lower Super Output Areas (LSOAs), in England. Below are the main releases and the interactive local data explorer.
MHCLG - IMD 2025 statistical release
Dataset
MHCLG - IMD 2025 - technical report
Report
MHCLG -IMD 2025 local data explorer
Dataset
The Impact Lab - IMD2025 tools
Visualisation
Archived reports and data
This section contains archived content from the IMD 2015 and IMD 2010. For the latest data on deprivation in Southampton, please refer to the IMD 2019 resources above. The data underpinning the 2010 and 2015 indices are outdated and have been superseded by IMD 2019, which should be used in most instances. However, reports and data relating to IMD 2015 and IMD 2010 are provided below for comparative purposes.
IMD (2019) - Southampton analysis summary slide set
pdf | 17.4 MB | 26.06.2023
IMD (2015) - Southampton analysis summary slide set
pdf | 751.6 KB | 08.09.2017
IMD (2010) - Southampton analysis summary slide set
pdf | 6.0 MB | 24.05.2011
Geographical Profiles Dashboard
This dashboard provides profiles for neighbourhoods, electoral wards and localities in Southampton. These profiles have been produced to meet the need for information and intelligence at the local level in the city and form part of the Single Needs Assessment for Southampton. These profiles pull together information across a range of topics including demography, economy, community safety, health, education and social care to better understand the local population need at sub-city geographies.
Geographical Profiles Dashboard
Visualisation
Benefit maps time series dashboard
In order to better understand and track the economic impacts of COVID-19 on our communities, a time series Power BI dashboard of maps has been produced, illustrating the change in the percentage of the working age population claiming Universal Credit and Job Seekers Allowance.
Benefit maps time series dashboard
Visualisation
OHID Fingertips data - Deprivation indicators
Data on deprivation and poverty in Southampton, can be found on the Office for Health Improvement and Disparities (OHID) Fingertips tools, which bring together data indicators on deprivation and poverty at local authority level. These can be used to explore the data over time and between comparator areas.
OHID Fingertips – Deprivation indicators
Dataset
Department for Education data
The Department for Education (DfE) provide a range of data on school and pupil numbers and their characteristics, including information relating to deprivation and poverty such as free school meal eligibility.
DfE - Schools, pupils and their characteristics
Dataset
Department for Work and Pensions data
The Department for Work and Pensions (DWP) provide annual statistics on the number and proportion of children living in low income families.
DWP - Children in low income families: local area statistics 2014 to 2022
Dataset
OHID - Inclusion health data and intelligence resource for England
Local data and insight on health needs and outcomes for inclusion health populations are not routinely available. The resource collates numerical population data into one place and summarises academic research and published material to highlight health needs. It is divided up into main messages, data, health overview and policy, guidance and further resources.
OHID - Inclusion health data and intelligence resource for England
Website
OHID - Health of the region data explorer
The health of the region data explorer brings together a regional and local authority view of the latest annual public health data and indicators. The report draws on published data alongside context and interpretation covering a wide range of public health topics, including life expectancy, mortality and burden of disease, wider determinants of health, best start in life, risk factor and disease prevalence and healthy ageing. Remember to change the region and local authority on the top right before using this tool.
OHID - Health of the region data explorer
Visualisation
Last updated: 19 February 2026