Economic assessment
Southampton Economic Assessment background
 The COVID-19 pandemic, the Cost of Living Crisis and the war in Ukraine have been key factors challenging the economic situation of the UK over the last five years. The UK economy is showing signs of slowly recovering with gross domestic product (GDP) estimating to have grown by 0.5% in the three months to May 2025, compared with the three months to February 2025, mainly because of growth in the services sector (ONS – GDP monthly estimate - May 2025). Under the new government, place-based strategies have been rising in popularity in order to promote economic growth. In February 2025 the Government announced that Southampton City Council, Portsmouth City Council, Hampshire County Council and Isle of Wight Council had been successful in their joint bid for inclusion on the Government's fast-track Devolution Priority Programme. Devolution is the transfer of powers and funding from national to local government. It is a process that enables more decisions to be made locally, closer to the residents and businesses affected for example on housing, regeneration, skills and growth.
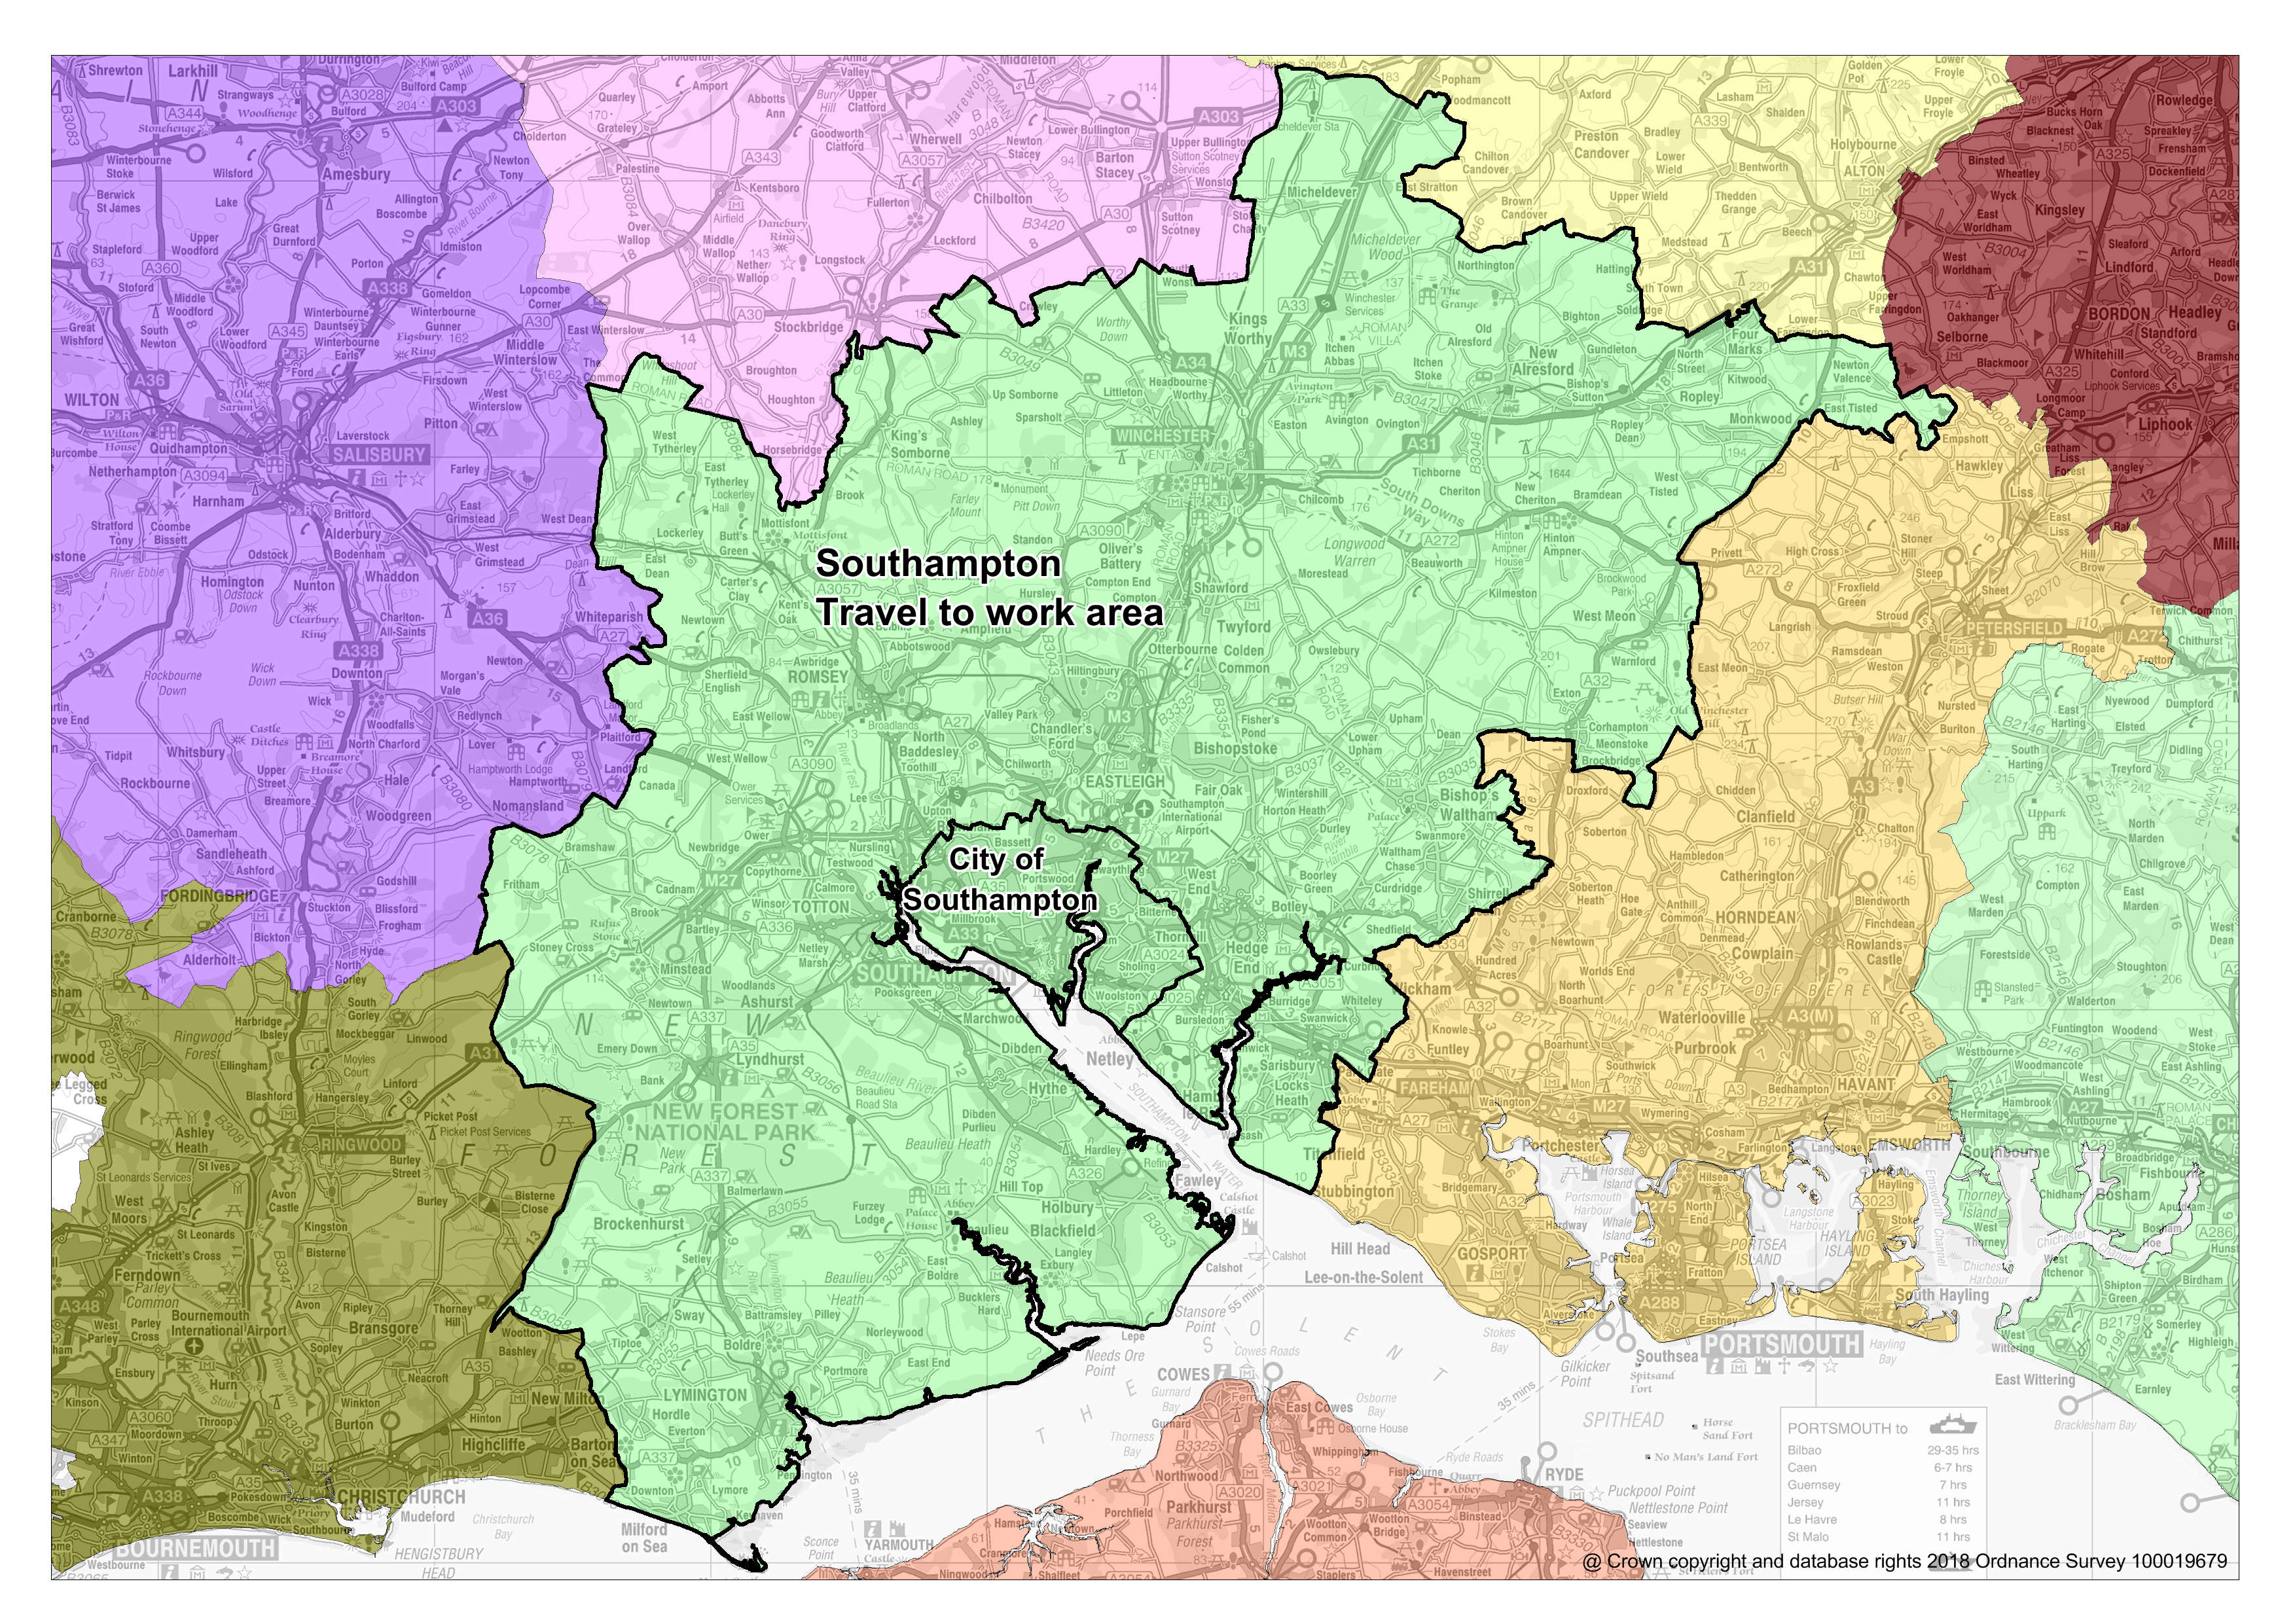 There are a number of reports on the local economy, but most focus on the Hampshire Economic Area or the Southampton Travel to Work Area (TTWA). For example, the PwC Good Growth for Cities 2024 report ranks Southampton (TTWA) third for good growth scores by city. This recent report also gives Southampton an above average rating overall and for jobs, income, health, new businesses, skills, environment and safety. As well as average ratings for work-life balance, transport, income distribution and high streets & shops. Housing is the only indicator with a below average rating.
Although the findings of these reports provide an indication of the direction of travel, they are not specific to Southampton. Therefore, there continues to be a need for specific intelligence on the Southampton economy to compliment wider regional analyses and to help drive strategic decision making on economic development. The Southampton Economic Assessment is intended to provide a baseline as to the strength of the Southampton economy, based on the administrative boundary of the local authority. It considers productivity and growth, business and enterprise, the job market, employment, skills and earnings.
Further data on Southampton can be found in the interactive Power BI dashboard linked below. The dashboard allows the user to interact with a range of economic data to help better understand different aspects of the city’s economy. Further information, including a range of relevant reports and datasets can also be found in the resources section at the bottom of the page.
Economic dashboard
Visualisation
Productivity and growth
 Productivity and growth can be measured using Gross Value Added (GVA), which is a key economic indicator. It measures the performance of each individual producer or industry and their input to the economy. Data on GVA is published by the Office for National Statistics (ONS) annually. The assessment uses the balanced measure (B), which is produced by combining income and production approach measures using weighted quality metrics. GVA(B) data is available at various geographical levels and by various industry groups. Each time data is published, ONS also publishes revisions to past data; this means that values for a particular year may differ in different publications. It is important to note that GVA(B) data for the latest year (2023) is provisional.
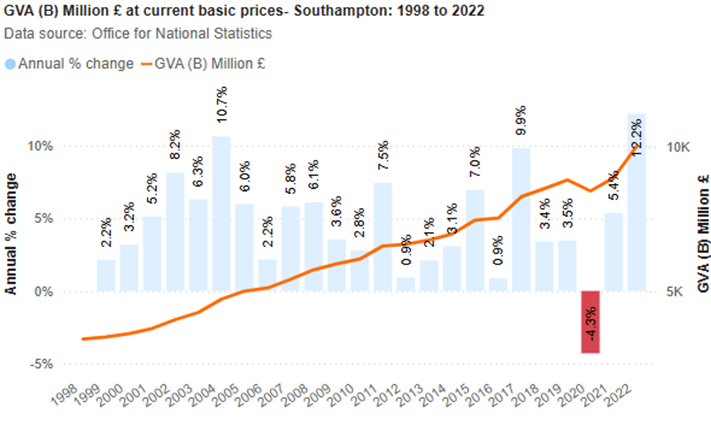
The ONS publish GVA estimates annually, with data for the latest year being provisional. This leads to previous years being subject to revisions and rebalancing in each release. In the 2022 release the ONS identified a change in the UK National Accounts that resulted in a long-term revision to the manufacturing of food, beverages and tobacco industry. In the latest GVA release (2023) Southampton’s economy is valued at £10 billion, an increase of 10.6% since 2022. In the 2023 release manufacturing has the highest share of total GVA (b) at 16.3%, followed by human health and social work services at 14.0%.
GVA(B) per head of population has also increased in Southampton, from £35,460 in 2019 to £38,980 in 2023, an increase of 9.9% or +£3,520. The latest revisions have impacted the long-term trend of GVA(B) per head, with Southampton now showing to have had a value greater than England and South East averages consistently since 2009. In 2023, Southampton had the fourth highest GVA(B) per head amongst ONS comparators. Again, highlighting the relatively high productivity of the local economy. GVA(B) per head is a useful way of comparing regions of different sizes and is an important indicator for benchmarking economic growth.
Many industries in Southampton were affected by the COVID-19 pandemic and have experienced varied levels of growth since. The latest estimates suggest that transportation & storage saw the most growth locally between 2021 and 2023 (+£346 million). Although, this remains -£492 million lower than in 2019. Human health and social work activities were the second highest increase locally in the last two years (+£327 million). Overall, 13 of the 18 industries analysed experienced an increase in GVA(B) between 2021 and 2023, with three remaining below their 2019 GVA(B) value. The manufacturing industry experienced the largest decline in GVA between 2021 and 2023 (-£453 million).
Manufacturing continues to have the highest share of GVA(B) locally at 16.3% in 2023, significantly higher than the national average (8.9%). Although it is important to note that, this is likely influenced by economic ownership of overseas manufacturing operations. Transportation & storage (12%) and ‘public sector’ industries (27% combined) hold a higher proportion of GVA(B) in Southampton compared to England (3% and 19% respectively).
Further data on productivity and growth in Southampton can be found in the interactive Power BI dashboard linked below. The dashboard allows the user to interact with a range of economic data to help better understand different aspects of the city’s economy. Further information, including a range of relevant reports and datasets can also be found in the resources section at the bottom of the page.
Economic dashboard
Visualisation
Business and enterprise in Southampton
Information on the number of businesses in Southampton is available from the UK Business: Activity, Size and Location annual data release from the Office for National Statistics (ONS) and from the annual ONS Business Demography dataset. Both datasets are produced from an extract taken from the Inter Departmental Business Register (IDBR) which represents the businesses registered with HM Revenue and Customs (HMRC) for VAT and/or Pay As You Earn (PAYE). The former examines the business population at the end of the financial year (snapshot), whilst the latter considers all businesses that were ‘active’ at any point during the year.
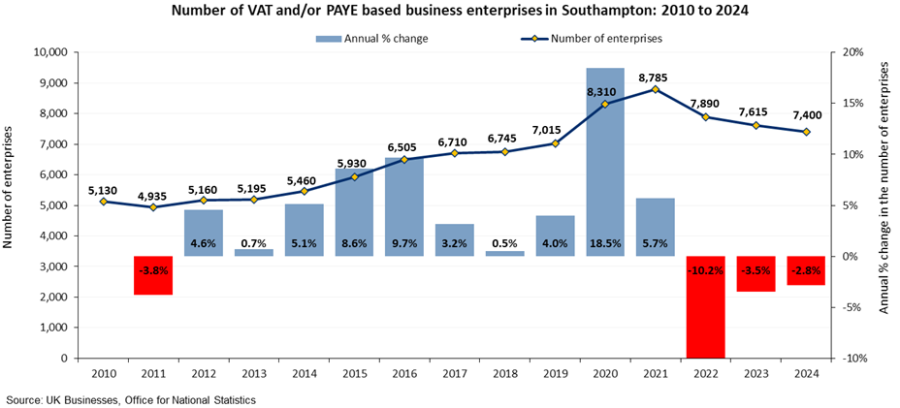 The ONS UK Business data tends to be used to examine trends in the number of businesses in the city, whilst the ONS Business Demography data is used to examine new business start-ups and business survival rates in line with ONS guidance. It is important to note that datasets for Southampton were impacted by multiple business registrations to a single postcode in 2019 and 2020, which explains the large decline seen in these years in the number of businesses and births. More detailed information on this issue has been published by the Office for National Statistics.
As of March 2024, there were 7,400 businesses in Southampton. This is a decline of -2.8% (-215) compared to the previous year. Almost all the declines in the number of businesses over the last year in Southampton, have been driven by fewer micro enterprises (less than 10 employees) (-185 enterprises). The retail sector saw the largest decline (-155 enterprises) by industry, followed by construction (-35 enterprises) and professional, scientific and technical (-30 enterprises). Despite a decline in retail enterprises, it is the second most common industrial group in Southampton; 14% share of enterprises in 2024 (compared to 8% nationally). Transport and storage (10%) also have double the share of enterprises compared to nationally (4%), whereas the proportion of professional, scientific and technical enterprises is notably smaller (12%, compared to 16%). The proportion of other industries are fairly similar to England.
Also, business density (per head of population) remains significantly lower in Southampton than the England average (421 per 10,000 working age population, compared to 653). This may be reflective of the local industry profile (large public sector employers) and the large student population in Southampton. However, it may also be reflective of the lack of suitable premises for new businesses in the city, as total business floorspace has declined by -17.2% between 2000/01 and 2022/23.
There were 1,005 business births in Southampton during 2023, translating to a rate of 57.1 per 10,000 working age population. This represents a decline of -29.5% (-420) compared to the previous year. The birth rate in 2023 is significantly lower than the national average (77.7 per 10,000 working age population).
In 2023, there were 1,175 business deaths in Southampton, which is a decrease of -17.0% (-240) compared to the previous year. The death rate in 2023 is significantly lower than the national average (66.8 per 10,000 working age population, compared to 76). 92.3% of businesses formed in 2022 survived at least 1 year, which is similar to the national average (92.4%). Longer-term business survival in Southampton shows that 33.1% of businesses formed in 2018 survived 5 years, which is lower than the national average (39.4%). However, challenges brought about by Brexit, the coronavirus pandemic and recent economic uncertainty could continue to create obstacles for business survival going forwards.
Further data on business and enterprise in Southampton can be found in the interactive Power BI dashboard linked below. The dashboard allows the user to interact with a range of economic data to help better understand different aspects of the city’s economy. Further information, including a range of relevant reports and datasets can also be found in the resources section at the bottom of the page.
Economic dashboard
Visualisation
Employee jobs
 The number of employee jobs is one of the main indicators of the state of the economy. The changes in employee numbers may indicate whether the economy is growing or in decline, what the local strengths are and how significant the local changes are in comparison to other areas or against the regional or national average.
The ONS Business Register and Employment Survey (BRES) is the official source of employee and employment estimates in the UK. The survey collects employment information from a sample of some 85,000 businesses across Great Britain. Allowing for the analysis of workplace-based employee and employment estimates by detailed geography and industry, full-time or part-time workers and by public or private sector businesses. However, it should be noted that BRES does not cover the very small businesses neither registered for VAT nor Pay-As-You-Earn (PAYE), which make up a small part of the economy.
Southampton continues to be a key employment centre in Hampshire, with a job density of 23.1 jobs per hectare, although this is below Portsmouth (26.3 jobs per hectare). In terms of the number of jobs per head of population, Southampton continues to be below the national average (0.76) and the lowest amongst comparator areas at 0.66 jobs per working age population.
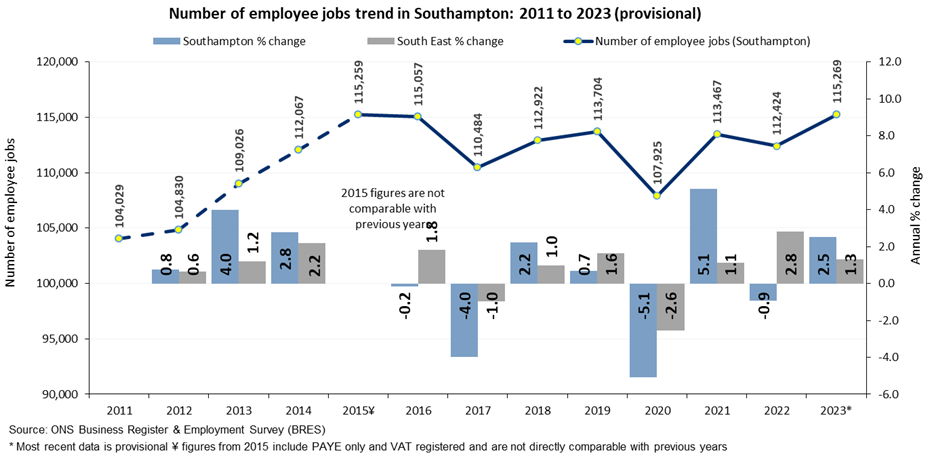
In 2023, there were 115,269 workers employed in Southampton. Employee jobs increased by +2.5% (2,845) in Southampton; a larger increase than seen across the South East and England (both +1.3%).
From 2022 to 2023, the number of employee jobs in the private sector increased (+2,536, +3.0%), with an increase in both the number of full-time employees (+2.4%) and part-time employees (+4.0%). Similarly, the number of public sector employees increased by +1.1% (+309), which was driven by increase in both full-time (+1.6%) and part-time employees (+0.2%). Overall, from 2015 to 2023 in Southampton there has been a 0% change in employee jobs. Whilst the number of employee jobs across England (+9.8%) and the South East (+6.2%) has grown since 2015.
Data from Lightcast (5th March 2025) shows that the number of unique job postings in Southampton had increased between 2020 and 2023 but declined in 2024. There were 344 unique job postings per 1,000 working age population in Southampton during 2024, significantly higher than the national rate (208 per 1,000). This ranks Southampton second highest among ONS comparators, consistent with previous years. Median advertised wages continue to remain higher than the long-term average, having averaged £31.8k per year during the 2024 calendar year.
Additionally, 4.4% of Southampton job postings included ‘green skills’; a grouping defined by Lightcast (5th March 2025) that has been used to estimate green job creation (including conservation, environmental sciences, renewable energy, waste management). This is a significantly higher proportion than the national average (3.6%), but lower than several ONS comparators. Moreover, whilst Southampton remains a major centre for employment in the South East, attracting higher value businesses and more skilled jobs could benefit our residents.
Further data on employee jobs in Southampton can be found in the interactive Power BI dashboard linked below. The dashboard allows the user to interact with a range of economic data to help better understand different aspects of the city’s economy. Further information, including a range of relevant reports and datasets can also be found in the resources section at the bottom of the page.
Economic dashboard
Visualisation
Labour market
As well as considering the number and makeup of businesses and jobs in Southampton, it is important to understand in detail the character of Southampton’s resident working age population; not least because this is materially important with regard to the city’s wider economic prospects.
 In 2023/24, 79.2% (137,300) of the working age population in Southampton were economically active, decreasing by -0.9 percentage points (-2,000 people) from the previous year, despite a decline over the last year, Southampton remains similar to both the national (78.8%) and South East (82.3%) averages.
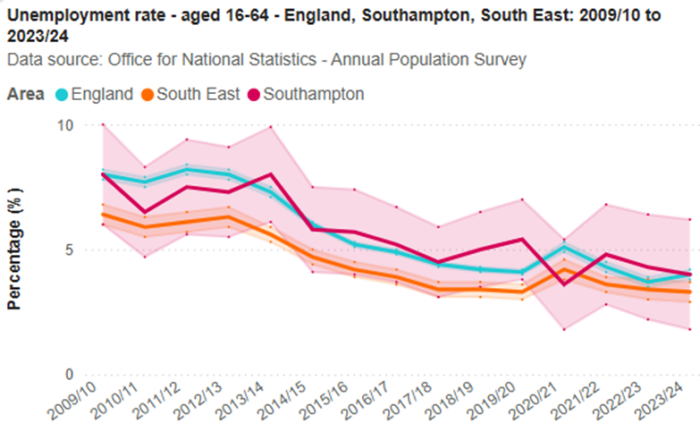
In addition, unemployment in Southampton has experienced an overall decline since 2010. In 2023/24, 4.0% (5,400) of working age adults in Southampton were unemployed, a decrease from the previous financial year (4.3%). Although, it is important to emphasise that the changes observed in Southampton in recent years are not statistically significant. Unemployment data is from the Labour Force Survey (LFS), which is considered the most reliable source of unemployment data, following changes to the benefits system and the introduction of Universal Credit.
Claimant count data is published monthly and allows for the proportion of adults claiming out of work benefits to be monitored in detail. Claimant count data is more timely than unemployment data so allows us to monitor emerging trends. As of February 2025, 4.5% (7,910) of the working age population were claiming out of work benefits in Southampton; an increase of +640 claimants (+8.8%) since February 2024 (4.1%). Whilst progress has been made in recovering from the COVID-19 pandemic, Southampton is yet to return to the pre-pandemic baseline (less than 3.5% in January to March 2020). This could possibly be linked to recent cost of living crisis and economic uncertainty.
Unemployment is not evenly distributed across the city. As of February 2025, there was a 5.1 percentage point inequality gap in the proportion of adults claiming unemployment benefits between the 20% most and 20% least deprived neighbourhoods in Southampton. This is significantly lower than the pandemic peak; an 8.1 percentage point difference in April 2021. More information on this ongoing time series can be found on the benefits page.
Further data on the labour market in Southampton can be found in the interactive Power BI dashboard linked below. The dashboard allows the user to interact with a range of economic data to help better understand different aspects of the city’s economy. Further information, including a range of relevant reports and datasets can also be found in the resources section at the bottom of the page.
Economic dashboard
Visualisation
Skills and qualifications
It is important to consider skill levels of both the residents and workforce and whether they meet the needs of employers in the city. The Annual Population Survey (APS) records the qualifications of working age residents classified into a Regulated Qualification Framework (RQF). The RQF replaced NVQ (National Vocational Qualification) and equivalent levels classification, with the APS switching their qualifications reporting from NVQ to RQF from 2022 onwards.
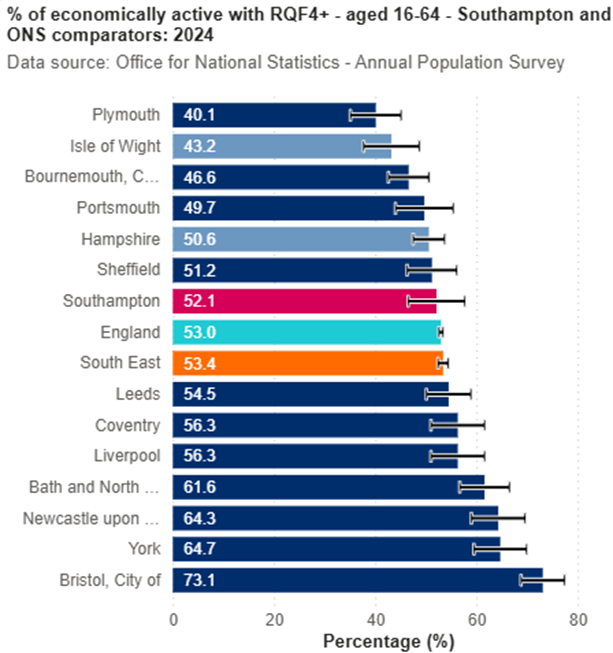
RQF Level 4 and above (degree level) qualifications are often taken as a prerequisite for participation in the high value-added knowledge economy. The proportion of the population qualified to RQF Level 4 or above in the city has experienced a non-significant increase from 44.4% in 2023 to 52.1% in 2024. Whilst degree level qualifications can be used as a proxy for graduate retention, there are currently only three data points in the RQF series. Therefore, it will be important to monitor this trend moving forward.
Experimental statistics published in 2023 by the ONS show that in 2019 the Southampton Travel to Work Area retained 57.0% of its graduates and had a graduate net gain rate of -0.1%. Both these percentages are higher than the England median (51.3% and -10.1% respectively) suggesting the area does have higher graduate retention.
Data from Lightcast (5th March 2025) suggests that 12.8% of residents in Southampton with online job profiles attended either the University of Southampton (6.8%) or Southampton Solent University (6.0%). This places Southampton mid-rank among ONS comparators; highest among southern comparators and York, but lower than other northern comparators and Bristol.
In 2024, 23.5% of economically active adults in Southampton have RQF Level 3 qualifications only (A-levels and equivalent); higher but not significantly than the national average (20.2%). This is likely because of the large student population in Southampton, who require RQF Level 3 qualifications as a gateway into university. This proportion has declined in the last year, having been 25.3% in 2023. The two universities in Southampton are valuable assets in terms of employment, improving workforce skills and supporting knowledge-based industries in the city.
On the other hand, 4.0% (5,300) of Southampton’s economically active population have either no or low qualifications (RQF Level 1 or below), a decrease compared to the previous year (7.7% in 2023). Whilst it is not advised to compare RQF to the historic NVQ classification, the proportion of economically active residents with low or no qualifications in Southampton had declined between 2011 and 2021. This suggests that the level of qualifications among residents was improving. However, trends under the RQF classification will continue to be monitored going forwards.
It is also important to consider school attainment in the city, as attainment is key to improving the life chances of young people in the city. In particular with regards to finding skilled employment after leaving school. This is especially important for children from the most deprived areas of the city, where school attainment is poor and benefit claimant rates high. In 2023/24, Southampton had the third lowest pupil average attainment 8 score (41.3) among ONS comparators and a decline from last year. Additionally, Southampton had the third lowest proportion of pupils achieving grades 5 or above in English and Mathematics (38.3%) in 2023/24.
Further data on skills and qualifications in Southampton can be found in the interactive Power BI dashboard linked below. The dashboard allows the user to interact with a range of economic data to help better understand different aspects of the city’s economy. Further information, including a range of relevant reports and datasets can also be found in the resources section at the bottom of the page.
Economic dashboard
Visualisation
Earnings and economic flows
In a period of sustained austerity since 2010 in response to the economic downturn and deficit reduction, wages for many were cut or frozen. However, wages have been on an upward trend in Southampton since 2013. Yet as a result of unprecedented inflation since late-2021 (the cost of living crisis), issues of earnings and real wage growth remain topical.
 The Annual Survey of Hours and Earnings (ASHE) available from the Office for National Statistics (ONS) evaluates earning levels nationally and locally. This provides a picture of the median gross incomes of residents living in an area and of those people working in an area. The information on wages is based on full time employees working more than 30 paid hours a week, or 25 or more for teaching professions. It is based on a 1% sample of employee jobs from HM Revenue and Customs PAYE records.
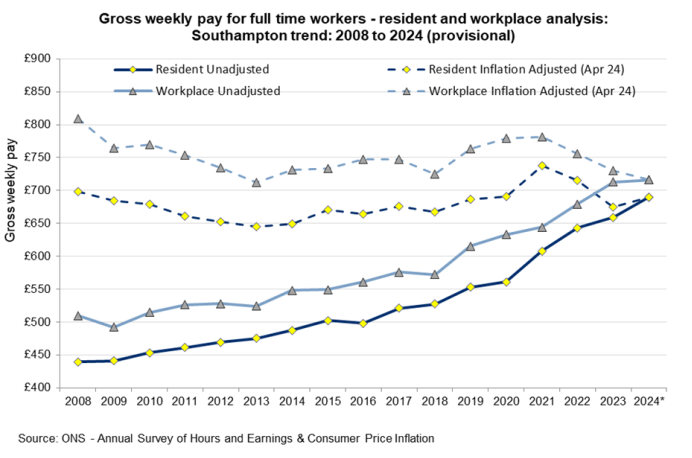
In Southampton, there continues to be an inequality gap in terms of pay between those working in the city and those resident in the city. In 2024, the median gross weekly pay for full-time workers was £716, compared to £690 for residents; a difference of £26. Workplace pay and resident pay are both lower but not significantly than the England average.
After adjusting for inflation, pay declined in ‘real’ terms between 2008 and 2013. From 2013 to 2021, weekly pay had generally increased in ‘real’ terms for both residents and workers in Southampton. However, any growth since has been stunted by unprecedented high inflation since late 2021. The PwC estimate real earnings to be lower than they were in 2006; equivalent to almost two decades of no net growth in earnings. Adjusted for inflation, resident (+£15, +2.3%) earnings increased between 2023 and 2024 but workplace (-£14, -1.9%) earnings declined between 2023 and 2024. However, comparing between 2021 and 2024 both resident (-£47, -6.4%) and workplace (-£65, -8.3%) declined in real terms. This is a result of wages being unable to keep up with unprecedented inflation since late 2021.
Based on 2021 Census data, over 24,000 people commute into Southampton for work, whereas almost 29,500 commute out of the city. There is a clear relationship with Eastleigh, with a large economic flow both in (almost 7k) and out (almost 9k) of Southampton. Significant numbers also commute between the New Forest, Test Valley and Winchester. Furthermore, Southampton has the second lowest net in-commute of workers (-5,433) among ONS comparators. As well as, the lowest proportion of people who both live and work within their local area (75.1%) among comparator cities.
As 2021 Census data was collected during the COVID-19 pandemic, it is likely that lockdowns and furlough impacted travel to work data. Therefore, it is not advised to compare to previously published travel to work data. However, hybrid and home working have remained more common post-pandemic (ONS – Is hybrid working here to stay?).
Given the difference between resident and workplace earnings plus negative net commute, it is possible that some lower skilled residents are being displaced into lower paid employment outside of the city by skilled workers commuting into the city. Higher levels of income for workers are not directly reflected in the economic wellbeing of residents, which amongst other things is likely to result in poorer outcomes and higher demand for public services including health and social care.
Further data on earnings and economic flows in Southampton can be found in the interactive Power BI dashboard linked below. The dashboard allows the user to interact with a range of economic data to help better understand different aspects of the city’s economy. Further information, including a range of relevant reports and datasets can also be found in the resources section at the bottom of the page.
Economic dashboard
Visualisation
Resources
Southampton economic assessment
The Southampton Economic Assessment was last updated in August 2025. A slide set was produced updating the key messages for the city. An interactive dashboard was also developed alongside the slide set and this webpage to provide the latest economic data for Southampton. Archived assessments from 2017 to 2024 can be downloaded from the section below.
Economic dashboard
Visualisation
Economic Assessment August 2025 Slide Set
pdf | 3.3 MB | 07.08.2025
Archived assessments
This section contains archived reports from previous Southampton Economic Assessments. The latest data on the economy in the city, is presented in the rest of this webpage and the Economic Dashboard.
2024 Summary slide set
pdf | 3.7 MB | 27.03.2024
2023 Summary slide set
pdf | 4.4 MB | 12.06.2023
2022 Summary slide set
pdf | 4.7 MB | 31.08.2022
2021 Summary slide set
pdf | 4.2 MB | 19.03.2021
2020 Summary slide set
pdf | 5.3 MB | 22.07.2020
2019 Summary slide set
pdf | 4.9 MB | 17.05.2019
2018 Summary slide set
pdf | 5.2 MB | 01.02.2018
2017 Overall report
PwC reports
PwC (PricewaterhouseCoopers International Ltd.) publish a range of national reports which help to inform parts of the Southampton Economic Assessment. Links to recent PwC reports are provided below.
PwC - Good Growth for Cities 2024
Report
PwC - UK Economic Outlook November 2023
Report
PwC - Good Growth for Cities 2023
Report
PwC - UK Economic Outlook April 2023
Report
PwC - Green Jobs Barometer 2022
Report
PwC - Good Growth for Cities 2022
Report
PwC - UK Economic Outlook April 2022
Report
PwC - UK Economic Outlook December 2021
Report
Office for Budget Responsibility reports
The Office for Budget Responsibility (OBR) publish economic and fiscal outlooks based on the government's national budget and policies. A link to the latest OBR economic and fiscal outlook is provided below.
OBR - Economic and fiscal outlook October 2024
Report
ONS economic data and resources
The Office for National Statistics (ONS) publish a range of statistics on the UK economy each year including data on productivity, businesses, jobs and earnings. Data is published annually and is available at local authority level which enables local benchmarking and trend analysis to be conducted. Links to some of the most valuable datasets and analysis are provided below.
ONS - Gross Value Added (GVA) balanced (B)
Report
ONS - UK Business: Activity, Size and Location
Report
ONS - Business Demography
Report
ONS - Guide to Business Statistics
Report
ONS - Business Register and Employment Survey (BRES)
Report
ONS - Annual Survey of Hours and Earnings (ASHE)
Report
Benefit maps time series dashboard
Below is a time series Power BI dashboard illustrating the change in the percentage of the working age population claiming Universal credit and Job Seekers Allowance claimants for the last 25 months.
Benefit maps time series dashboard
Visualisation
OCSI - A guide of unemployment data
A look at the data behind the headlines, how it was collected and what it can and can not be used for.
OSCI - A guide of unemployment data
Report
DfE - Local Skills Dashboard
The Department for Education have released an interactive dashboard to support local skills planning, the dashboard covers topics such as employment, qualifications, and education outcomes across England. Data is available to view and download for various geographies, including: local authority (LA), local skills improvement plan (LSIP) area, local enterprise partnership (LEP), Mayoral Combined Authority (MCA), regional and national.
Department for Education - Local Skills Dashboard
Visualisation
Last updated: 07 August 2025