Drugs
Drugs overview

If you are worried about your own, or someone else’s, use of drugs, help is available. Please follow this link for local advice, help and support: Drug and alcohol advice.
This page summarizes key facts and the latest available data on drug use and drug-related harm in Southampton, including risk factors, hospital admissions, deaths and treatment.
Drug use can cause significant physical and psychological harm to the individual as well as affecting friends, families, and communities.
Drug use is a significant cause of premature mortality in England. Analysis in the Global Burden of Disease study (2019) shows that drug use disorders are now the third highest ranked cause of death in the 15 to 49 age group in England.
In Southampton between 2021 and 2023 there were 59 drug-related deaths, equivalent to 1,598 years of life lost, a greater loss of life than that caused by lung cancer (329 deaths and 1,318 years of life lost).
People may begin using drugs before they can fully understand or judge the immediate and long-term risks. Drugs can seem like they help in the short term, particularly when someone is feeling stressed, tired, shy or lonely. However, they can also make people feel worse through cravings, low mood and/or anxiety.
For many people with drug dependence, continued use is a symptom of other problems such as mental ill health, abuse, grief, loss, and other trauma. This can make it difficult to limit, reduce or stop using without support and sometimes even with support. Many people feel ashamed or worry about judgement or stigma. It can take courage to seek help. A compassionate, non-judgmental approach, including self-compassion can make it easier to make the first step, stay engaged in support and improve outcomes. Judgement from others can put people off seeking support.
Drugs dashboard
Visualisation
Southampton’s risk factors
ONS figures estimated that 1 in 11 adults (8.7%) aged 16 to 59 reported using any drug in the last 12 months for the year ending March 2025 in England. Some characteristics of Southampton suggest that this may have the potential to be higher in the city.
- Southampton is a large urban city (and port city):
- National survey findings have shown higher reported drug use in urban areas than rural areas.
- Southampton has slightly more men than women living in the city (men are more likely than women to report drug use):
- In England, 10.5% of men used a drug in the last 12 months compared to 6.9% of women.
- Southampton is a young city:
- In England, about 1 in 7 (15.1%) 16 to 24 year olds have taken a drug within the last year. This age group are also more likely to be frequent drug users (defined as taking any drug more than once a month) at 3.5%, 1.8 times higher when compared to people ages 16 to 59 years.
- Frequent drug use is not a proxy measure for drug dependence.
- Southampton has a higher proportion of private renters than observed across England:
- Higher drug use has been reported among private renters than homeowners in the last year.
- Higher drug use has been reported among private renters than homeowners in the last year.
- Over 45% of Southampton's population live in the neighbourhoods within the 30% most deprived areas in England:
- Those in the lowest total household income bands were more likely to have taken any drug. Although, any class A usage was higher in higher income households.
Drugs dashboard
Visualisation
Hospital admissions related to drug use
In England, admission differ by age band and deprivation. Hospital admission rates for drug-related mental and behavioural disorders, are highest amongst 25 to 34 year olds. For admission for drug poisoning, the highest is amongst 35 to 44 year olds. Despite this, the 55 to 64 years old category has seen the largest percentage increase in both drug admission types since 2012/13. Admissions for drug poisoning were almost 5 times more likely in the most deprived areas compared to the least and for drug-related mental and behavioural disorder admissions, this was 8 times more likely in the most deprived (NHS Digital- hospital admissions).
For Southampton, hospital admissions due to substance use is only available for young people aged 15 to 24. From 2013/14 to 2015/16, Southampton was statistically similar to England and rose at a similar rate. Southampton reached a peak rate of 113.0 per 100,000 in 2015/16 to 2017/18, significantly higher than England (87.2 per 100,000). Southampton rates have decreased in line with England’s trend, while remaining significantly higher than England. In 2021/22 to 2023/24, Southampton’s rate was 67.0 per 100,000, the lowest it’s been since 2009/10 to 2011/12.
At sub-city level, Freemantle ward has the highest admissions with a rate of 328.2 per 100,000 in 2020/21 to 2022/23, significantly higher than the Southampton average of 80.1 per 100,000. By England deprivation, the 20% most deprived areas of Southampton have the highest rate of admissions (113.3 per 100,000).
For drug poisoning admissions, Southampton in 2023/24 is the 4th highest amongst CIPFA comparators with a rate of 26.4 per 100,000, also significantly higher than England (17.5 per 100,000). At a sub-city level, Freemantle has the highest admissions with a rate of 70.9 per 100,000, significantly higher than the Southampton average of 33.4 per 100,000 during the period of 2020/21 to 2022/23.
Drugs dashboard
Visualisation
Mortality and years of life lost
'Drug use deaths' are a subset of 'drug poisoning deaths'. When deaths are shown by drug type, some figures include only deaths involving drugs classed as 'controlled drugs'.
In Southampton during 2022-24, 10.4 per 100,000 people died from drug poisoning, with men just over 1.8 times as likely to die than women. Since 2018-20, the female rate has more than doubled from 3.2 to 7.3 per 100,000. Slightly fewer deaths were recorded as drug use deaths, at 5.2 per 100,000 people, an increase of 23.8% from 4.2 per 100,000 in 2021-23 (Deaths related to drug poisoning).
In Southampton, drug related deaths accounted for 5.9% of all years of life lost (1,868 years) in 2022-24 (pooled). There were 30 drug-related deaths in the same period, 1.5% of total deaths in Southampton.
Drugs dashboard
Visualisation
Care, treatment and policy
Access to services and unmet need
In 2024/25, 100% of individuals in contact with services in Southampton were seen within three weeks of referral. It is estimated that over half (56%) of people who use opiates and/or crack cocaine aged 18 and over were not in contact with drug treatment services, showing a high level of unmet need. The number of adults in treatment at specialist drug use services in Southampton equated to 7 in every 1,000 adults, higher when compared to the England average of 5 in 1,000 (2024/25).
Treatment outcomes
In 2023/24, among people in treatment for non-opioid use (e.g. crack cocaine, cannabis, ecstasy, hallucinogens and more) accessing treatment, 28.9% successfully completed the program and did not re-present within 6 months. This is a slight increase from 24.9% in 2022 and is now statistically similar to England (29.5%). For people in treatment for opioid use, 6.7% successfully completed treatment, significantly higher than England (5.1%).
Who is in treatment (England)
Across England in 2024/25, more than two-thirds of people in treatment were men (68% men; 32% women). This varies greatly by substance group. The age of those entering treatment has been increasing. The median age of those in treatment for problems with non-opiates is 32 years old, rising to 45 for those in treatment for problems involving opiates.
Referral routes into treatment
In Southampton, 2024/25 data from the National Drug Treatment Monitoring System (NDTMS), shows the most common referral route were self-referral (52%). This can include people seeking help following advice from a healthcare professional or with encouragement from family and friends. The next most common referral routes were:
- Criminal justice system (24%), mainly via arrest referral, prison or probation.
- Health and social care services (18%), including hospitals, GPs and social services.
For both drugs and alcohol, self-referral is the most common route. For alcohol-only referrals, the next two routes (health and social care service referrals and criminal justice) are in reverse order. In England, self-referral was also the most common referral source (55%), followed by health and social care services (22%) and then criminal justice system referrals (15%).
Deaths in treatment
In 2024/25, there were 20 recorded deaths in treatment in Southampton. This represents 1.1% of all people in treatment and 2.5% of treatment exits. Compared to 2023 to 2024, this was a decrease of 5 deaths and a decrease in the proportion of people in treatment dying (from 1.4%) and in the proportion of treatment exits (from 2.9%). People with opiate problems accounted for 75% of the deaths. In England, there were 4,273 recorded deaths in treatment, 1.3% of all people in treatment and 2.8% of treatment exits, similar to Southampton. Opiate problems accounted for 63% of deaths, lower than Southampton.
Drugs dashboard
Visualisation
Drug related crime
The relationship between illicit drug use and crime is complex and can involve several different pathways. This can include: offences related to the possession, use, or supply of controlled substances; offences committed to obtain money to buy drugs; offences committed while under the influence of drugs; and organised criminal activities linked to drug supply.
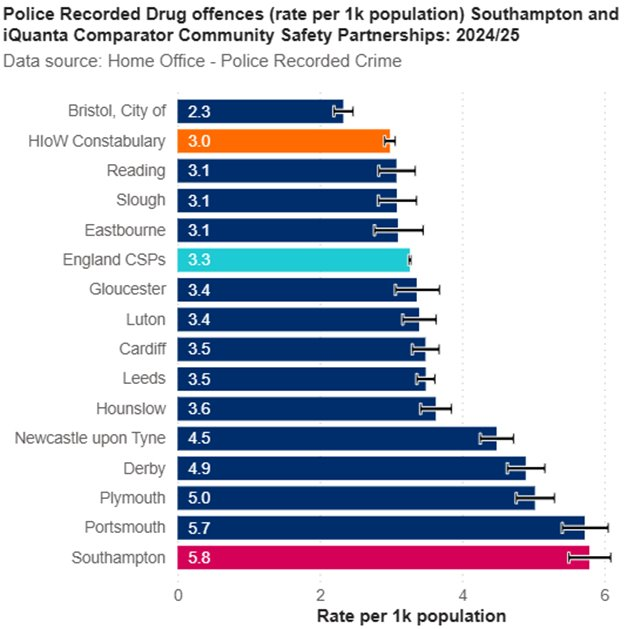
In 2024/25, Southampton had a drug offence rate of 5.8 per 1,000 population, significantly higher than the England average of 3.3 per 1,000. The number of drug offences in Southampton increased by 4.9% over the last year, higher than the Hampshire and Isle of Wight Constabulary increase (+4.2%), but lower than the national rise (+11.4%). In the same year, 1,258 drug affected crimes were recorded in Southampton, a 1.2% increase compared to 2023/24 (1,243).
Recorded drug offences are influenced by police activity and priorities, as well as underlying patterns of drug use and supply. In 2024/25, the number of stop checks in Southampton remained largely unchanged at 3,265, compared to 3,262 in the previous year. While this suggests a consistent level of enforcement, it also means fluctuations in drug offences are unlikely to be driven by changes in stop-check activity alone. Stop checks are used for a range of suspected offences, including drugs, knife crime and stolen goods, so they are not a direct measure of drug enforcement. Moreover, the majority of stop checks produce no recorded outcome, this year, 65.4% of stop checks found no object and 74.1% resulted in no further action.
In 2024/25, the drug offence rate was 2.9 times higher in the most deprived neighbourhoods (6.8 per 1,000) in the city compared to the least deprived (2.3 per 1,000). Similar to the previous year, the highest rate of drug offences was recorded across neighbourhoods in the second deprivation quintile (6.6 per 1,000 population) in 2024/25. Although, this was not significantly higher than the rate in the 20% most deprived neighbourhoods in Southampton. These are area-level patterns and do not describe individuals or communities; recorded rates can also reflect differences in police activity between these areas.
For more information on crime in Southampton, see the Safe City Strategic Assessment page.
Drugs dashboard
Visualisation
Resources
Drugs dashboard
The drugs dashboard presents a wide range of publicly available data on drugs to support strategic decision making, including the Southampton Tobacco, Alcohol and Drugs Strategy. It includes benchmarking against statistical neighbours, trends over time, and metadata for all indicators. Sub-city analysis is in development for certain indicators. Data is compiled from a range of sources including Office for Health Improvement and Disparities (OHID).
Drugs dashboard
Visualisation
Tobacco, Alcohol and Drugs Strategy (TAD)
The TAD dashboard presents a range of data to help Southampton City Council monitor progress in reducing the harm related to tobacco, alcohol and drugs, including harms experienced by people who use these substances, people around them, and impacts across the city of Southampton. Progress is monitored through the Tobacco, Alcohol and Drugs Strategy 2023-2028.
Tobacco, Alcohol and Drugs Strategy (TAD)
Report
Tobacco, Alcohol and Drugs Strategy (TAD) dashboard
Visualisation
Adult Drug and Alcohol Needs Assessment 2025
This review describes the needs, impacts and issues relating to harmful and dependent use of alcohol and illegal drugs in Southampton. It supports the work of our Tobacco Alcohol and Drug Strategy and was undertaken by an independent organisation, Mike Pattinson Associates.
Adult Drug and Alcohol Needs Assessment 2025
Alcohol dashboard
This dashboard shows key alcohol related data for Southampton, England and other comparator cities. Data is compiled from a range of publicly available sources including the Office for Health Improvement and Disparities (OHID).
Alcohol dashboard
Visualisation
Safe City Strategic Assessment 2024/25
The Southampton Safe City Strategic Assessment provides an overview of current and future crime, disorder and community safety issues affecting Southampton and makes recommendations to enable the Partnership to focus the Safe City Strategy and local delivery plans. The report and slide set that informed the assessment are available below to download. The interactive community safety dashboard can be accessed using the link below.
2024/25 Safe City Strategic Assessment report
2024/25 Safe City Strategic Assessment presentation
pdf | 5.7 MB | 12.12.2025
Community Safety Dashboard
Visualisation
Southampton Reducing Drug Harm Partnership - Drugs Needs Assessment
The Drugs Needs Assessment is a compilation of existing intelligence to inform the local delivery plan for the Reducing Drug Harm Partnership for Southampton. The Partnership Scorecard is a data set of key performance indicators.
Southampton Reducing Drug Harm Partnership - Drugs Needs Assessment
pdf | 2.8 MB | 06.02.2023
RDHP Scorecard January 2026
Children and Young People’s Alcohol & Drugs Needs Assessment 2025
This additional Children and Young People’s Alcohol & Drugs Needs Assessment builds on the original (TADV 2023-2024), with an increased focus on qualitative data. This review describes the needs, impacts and issues relating to harmful and dependent use of alcohol and illegal drugs in Southampton. It supports the work of our Tobacco Alcohol and Drug Strategy and was undertaken by an independent organisation, Mike Pattinson Associates.
Children and Young People’s Alcohol & Drugs Needs Assessment 2025 (1)
Tobacco, Alcohol, Drugs and Vaping (TADV) Needs Assessment for Children and Young People in Southampton, 2023-2024
This is a one off needs assessment produced by a Public Health Registrar on placement in the Public Health team. It includes: • National data on prevalence applied to estimate tobacco, alcohol, drug and vaping use in Southampton. • Local data, including survey (BeeWell), Family Nurse Partnership and Children's Services data. • A rapid review on harms and impacts related to smoking, alcohol, drug use, and vaping (including data on crime and hospital admissions) • A description of DASH (children and young people’s drug and alcohol service) service users and parents in contact with CGL (adult drug and alcohol service). • Interviews with Southampton City Council and DASH staff about tobacco, alcohol, drugs and vaping to provide qualitative insights.
Tobacco, Alcohol, Drugs and Vaping (TADV) Needs Assessment for Children and Young People in Southampton, 2023-2024
pdf | 1.7 MB | 18.06.2024
Other data sources
Other data resources on drug use.
OHID - Adult substance misuse treatment statistics (2024/25)
Report
ONS - Drug misuse in England and Wales: year ending March 2025
Dataset
ONS - Deaths related to drug poisoning in England and Wales: 2024 registrations
Dataset
NHS England Digital - Statistics on Public Health
Dataset
NDTMS - National Drug Treatment Monitoring System statistics
Dataset
Drug and alcohol advice
If you are worried about your, or someone else’s use of drugs, help is at hand. Please follow this link for details of the advice, help and support available.
Drug and alcohol advice
Website
Last updated: 26 January 2026