Healthy weight
Healthy weight overview

Obesity is a global and complex public health concern. It is associated with reduced life expectancy and is a risk factor for a range of chronic diseases, including cardiovascular disease, type 2 diabetes, cancer, liver, and respiratory disease, and can also impact on mental health, (OHID – Obesity profile May 2024).
In 2022 to 2023, around two-thirds (64.0%) of adults, aged 18 years and over, estimated to be overweight or living with obesity. In the same period 29.5% of adults in Southampton were estimated to be living with obesity higher but not significantly when compared with 26.2% in England.
In England, 1 in 3 (35.8%) children leaving primary school are overweight including obesity and 1 in 5 are obese (22.1%).
Obesity prevalence is highest amongst the most deprived groups in society. Children in the most deprived parts of the country are more than twice as likely to be obese as their peers living in the richest areas. This is sowing the seeds of adult diseases and health inequalities in early childhood.
Healthy weight dashboard
Visualisation
Measuring healthy weight and obesity in Southampton
 There are several ways to measure healthy weight and obesity in the population. In children data is collected by the National Child Measurement Programme (NCMP), which uses a standardised measure to assess all children when they start and leave primary school. The NCMP measures the height and weight of children at reception (Year R) aged 4 to 5 and in their final year (Year 6) aged 10 to 11 years. Children’s Body Mass Index (BMI) is standardised for their age and sex by comparing against a recognised standard.
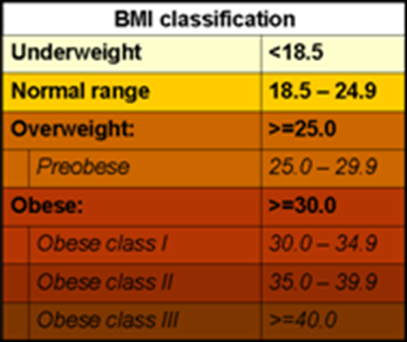
In adults, the most commonly used measure is by BMI, a simple index to classify overweight and obesity. It is defined as the weight in kilograms divided by the square of the height in metres (kg/m2).
BMI provides the most useful population-level measure of overweight and obesity, as it is the same for both sexes and for all ages of adults. However, it should be considered as a rough guide because it may not correspond to the same body fat percentage in different individuals.
More information can be found in the healthy weight dashboard below and in the resources section.
Healthy weight dashboard
Visualisation
Childhood obesity
Childhood obesity is one of the most serious public health challenges of the 21st century. The World Health Organisation suggests that overweight and obese children are likely to stay obese into adulthood and more likely to develop non-communicable diseases like diabetes and cardiovascular diseases at a younger age. Overweight and obesity, as well as their related diseases, are largely preventable. Prevention of childhood obesity therefore needs to be a high priority.
Data on childhood weight is taken from the NCMP, which covers children in Reception Year (aged 4 to 5 years), also known as Year R, and Year 6 (children aged 10 to 11 years) in mainstream state-maintained schools and measures children to check their weight. NCMP data enables local areas to plan services to tackle child obesity and monitor progress. For more information on defining the categories see the NHS Digital NCMP website.
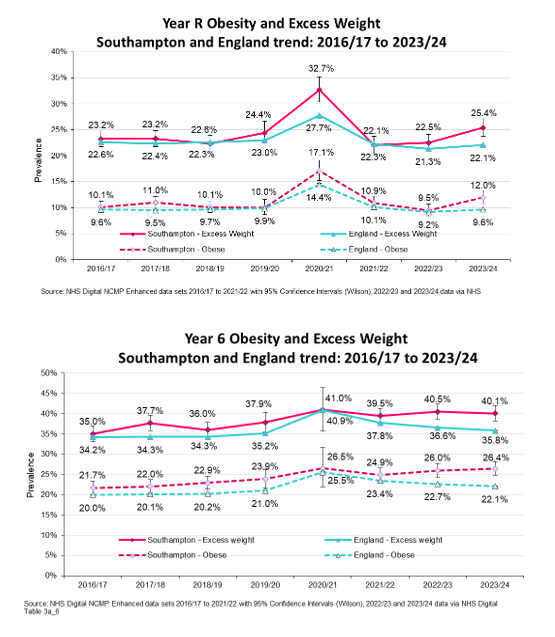 In Southampton, in 2023/24, the percentage of children in Reception Year who are overweight including obese, was 25.4%, similar to the England average of 22.1%. 73.6% are healthy weight, higher but not significantly than the England average of 76.8% and 1.0% are underweight in the city, lower than the England average of 1.2%.
During the same period in Southampton 40.1% of Year 6 children are overweight including obese, significantly worse than the England average (35.8%). The percentage of Year 6 children who are healthy weight (57.9%) are healthy weight, significantly worse than the England average of 62.5% and 2.1% are underweight, similar to the England average of 1.7%.
The gap in data for 2020/21 is due to the Coronavirus pandemic when data was not collected in schools due to school closures. Nationally, increases in child obesity and severe obesity prevalence in 2020 to 2021, follow the COVID-19 pandemic which resulted in school closures and other public health measures. More data is needed to know whether this is a long-term increase. (OHID - NCMP changes in the prevalence of child obesity between 2019 to 2020 and 2020 to 2021).
Source: NHS Digital National Child Measurement Programme (NCMP)
Looking at sub-city wards, based on pre-2023 ward boundaries, in Southampton by NCMP school weight measurements for 2018/19 to 2020/21, the prevalence range (highest and lowest) for Reception Year by BMI category are:
- Underweight - Highest ward is Bevois 3.1%. The lowest wards are Woolston and Redbridge 0.5%
- Healthy weight - Highest ward is Freemantle 81.0%. The lowest ward is Millbrook 63.6%
- Overweight - Highest ward is Woolston 17.0%. The lowest ward is Freemantle 4.1%
- Obese - Highest ward is Banister & Polygon 16.8%. The lowest ward is Bassett 5.2%
- Overweight including obese - Highest ward is Millbrook 33.3%. The lowest ward is Freemantle; 15.7%
The bullets below show the highest and lowest wards for Year 6 by BMI category:
- Underweight - Highest ward is Bargate 3.5%. The lowest ward is Peartree 0.7%
- Healthy weight - Highest ward is Portswood 68.9%. The lowest ward is Thornhill 48.0%
- Overweight - Highest ward is Peartree 19.3%. The lowest ward is Bassett 6.9%
- Obese - Highest ward is Woolston 33.6%. The lowest ward is Portswood 13.3%
- Overweight including obese - Highest ward is Coxford 45.2%. The lowest ward is Portswood 27.8%
More information and charts for wards are available in the healthy weight dashboard below or in the resources section.
Healthy weight dashboard
Visualisation
Linked analysis for child weight
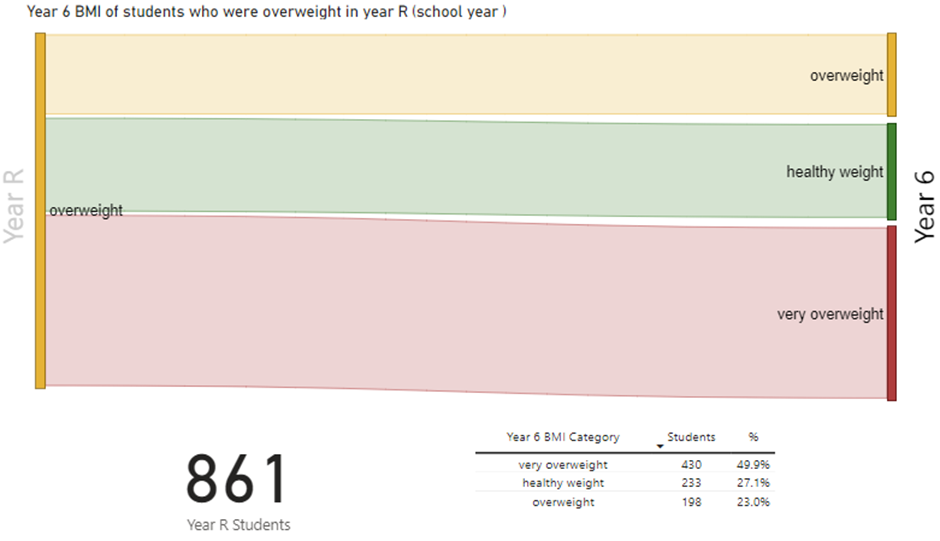
Analysis linking individual children’s weight recorded in Year R with that recorded for Year 6, gives an insight into childhood obesity patterns in Southampton. Looking at the group of children who were overweight in Year R, in 2015/16 to 2017/18 (12.4%), just under half of these (49.9%) became obese in 2021/22 to 2023/24 when in Year 6. Other outcomes were a fifth of this group (23.0%) had remained overweight, and 27.1% had become a healthy weight.
 Of the 10.3% of children who were obese in year R, over two-thirds (77.3%) of this group were still obese in Year 6, only a tenth had become a healthy weight by Year 6 (10.1%) and 12.6% were overweight.
We can also look retrospectively at the children who were Year 6 in 2021/22 to 2023/24 compared when they were in Year R children, in 2015/16 to 2017/18. The majority of overweight children in year 6 had been healthy weight (72.4%) in reception, whilst just over a fifth (20.1%) had remained overweight and a further 7.5% had been obese.
Of the 25.7% of children who were obese in Year 6, nearly half (43.1%) of this group had not been obese in reception. Although Year R obesity is a predictive factor for obesity in Year 6, interventions targeted only at this cohort only have the potential to reduce Year 6 obesity by one third.
The changes in weight status between Reception Year and Year 6, vary by the level of deprivation a child experiences. For the children overweight in Year R in the most deprived quintile, 41.7% will become obese but for those in the least deprived just over a third become obese (33.8%). In the most deprived quintile, nearly 4 out of 10 will return to a healthy weight in Year 6 after being overweight in Year R, however those in the least deprived have a similar outcome, where 4 out of 10 children return to a healthy weight.
In the most deprived quintile, 3 out of 10 will return to a healthy weight in Year 6 after being overweight in Year R, however those in the least deprived have a better outcome, where 4 out of 10 children return to a healthy weight.
More information on the linked analysis is available in the Child growth report for 2024 available below and in the resources section.
Child Growth Report - December 2024
pdf | 8.5 MB | 20.12.2024
Adult weight and obesity
For adults, overweight and obesity are significant health issues across the life course and into old age. Carrying excess weight can have significant implications for an individual’s physical and mental health. There isn’t a single intervention that can tackle obesity on its own, at population or at an individual level. Causes of obesity are multi-factorial, including biological, physiological, psycho-social, behavioural and environmental factors.
Being overweight or obese is linked to a wide range of diseases, most commonly:
- type 2 diabetes
- hypertension
- some cancers
- heart disease
- stroke
- liver disease
Obesity can also be associated with poor psychological health, emotional health and poor sleep. Obese adults may also be more likely to suffer from stigma which may impact on their self-esteem.
 In Southampton, in 2022/23, it is estimated that 29.5% of adults 18 years and over had a BMI classed as obese (around 60,692 adults), higher but similar to England (26.2%). Adults are classified as obese (BMI greater than or equal to 30kg/m²) (OHID Fingertips Obesity profile)
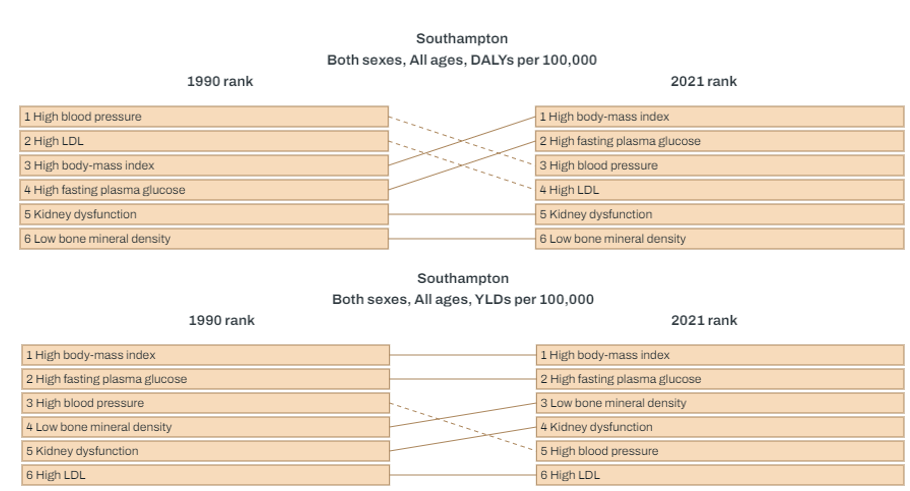
The Global Burden of Disease illustrates risk factors for mortality and poor health in Southampton and shows that high BMI feature as the third highest metabolic risk factors for Disability Adjusted Life Years Lost (DALYs) and the top metabolic risk factor for Years Lived with Disability (YLD) i.e. years of life lived with short-term or long-term health loss.
In July 2021 the Department of Health and Social Care introduced a new programme called the NHS Digital Weight Management Programme. This is to help overweight and obese adults with weight management and can be accessed with a referral from GP and primary care teams for those with a diagnosis of either diabetes, high blood pressure or both.
More information can be found in the healthy weight dashboard below and in the resources section.
Healthy weight dashboard
Visualisation
Physical activity
Regular physical activity provides a range of physical, mental and social benefits, many of which are increasing issues for individuals, communities and society. These include:
- reducing the risk of and helping manage many long-term conditions, for instance type 2 diabetes and cardiovascular disease
- helping manage existing conditions
- ensuring good musculoskeletal health
- developing and maintaining physical and mental function and independence
- supporting social inclusion
- helping maintain a healthy weight
- reducing inequalities for people with long-term conditions
According to national guidelines, from the UK Chief Medical Officer (CMO), children aged 5 to 18 years should be aiming to do an average of at least 60 minutes of moderate to vigorous intensity physical activity a day across the week. Children who do less than 30 minutes a day are defined as less active, while those that do between 30 and 59 minutes are fairly active. The guidelines include activities that develop movement skills, reduce inactivity and increase muscle and bone strength.
More information is available on the physical activity page.
Physical activity dashboard
Visualisation
Healthy weight dashboard
Visualisation
Tackling obesity
The Department of Health and Social Care (DHSC) and the Office for Health Improvement and Disparities (OHID) are leading on the campaign to tackle obesity in England.
In England, obesity costs the NHS around £6.5 billion a year and is the second biggest preventable cause of cancer. Over one in four (26%) adults and 23.4% of children aged 10-11 years in England are living with obesity, placing huge pressure on the health and care system.
The plans include:
- Restricting the placement of less healthy products in stores and online – for example near cashiers - to reduce the likelihood of impulse purchases.
- Introducing calorie labelling on menus in restaurants, cafes and takeaways so people know exactly how many calories are in their orders, helping them to make informed decisions about their choice of food.
- The NHS has introduced a soups and shakes diet for people with Type 2 diabetes.
- An obesity mission to explore new treatments and digital technologies which could support people achieve a healthier weight.
- Investment in school sports to help children and young people have an active start to life.
- Working with the NHS and local authorities to support people living with obesity reach a healthier weight by developing effective preventative care plans for those at high risk of weight gain and diet-related illness. Services range from behavioural weight management programmes to consideration of weight loss drugs and bariatric surgery.
The UK government and The Scientific Advisory Committee on Nutrition (SACN) concluded that sugar consumption increases the risk of consuming too many calories, the risk of tooth decay and that consumption of sugar sweetened beverages is associated with increased risk of type 2 diabetes and linked to higher weight in children. A single 330ml can of a soft drink with added sugar (which can contain as much as 35g of sugar), may instantly take a child over their maximum recommended daily intake of sugar.
The average sugar content of retailer and manufacturer branded drinks subject to the Soft Drinks Industry Levy decreasing by 46% between 2015 and 2020. Recent research estimated this may have prevented around 5,000 cases of obesity in Year 6 girls (aged 10-11 years), across all socio-economic groups. The sugar reduction programme has seen a 14.9% reduction of sugar in retailer and manufacturer branded breakfast cereals and 13.5% reduction in yogurts and fromage frais.
More information on the results is available from PLOS Medicine.
Resources
Healthy weight dashboard
The healthy weight dashboard which includes benchmarking against statistical neighbours and trends over time for adult and children’s weights. Analysis is also included at sub-city levels and by deprivation.
Healthy weight dashboard
Visualisation
Physical activity dashboard
The physical activity dashboard presents a range of data regarding physical activity, to provide intelligence to help drive strategic decision making, such as the Southampton Physical Activity and Sport Strategy and Cycling Southampton. Analysis includes benchmarking against statistical neighbours and trends over time. Some indicators include analysis at a sub-city level.
Physical activity dashboard
Visualisation
Child Growth Report
Childhood obesity linked analysis of changes in weight status in Southampton between Reception year (4-5 year olds) and Year 6 910-11 year olds) and child growth.
Child Growth Report - December 2024
pdf | 8.5 MB | 19.12.2024
OHID National Child Measurement Programme (NCMP): Child height in England - February 2025
This slide set presents data for England on the patterns and trends in average (mean) height of children age 5 years and 11 years and the prevalence of short stature among children in reception (age 4 to 5 years) and year 6 (age 10 to 11 years).
OHID National Child Measurement Programme: Child height in England February 2025
pdf | 279.8 KB | 05.02.2025
Food environment analysis
Analysis of the food environment and location of fast-food premises and supermarkets in Southampton
Food Environment Presentation 2024
pdf | 4.0 MB | 27.11.2024
Southampton Strategic Assessment - National Child Measurement Programme
Report for Southampton scrutiny panel on using the NCMP data collected in our schools, the adult national Active People Survey and all age Health Survey for England to investigate children’s weight in Southampton.
Scrutiny NCMP intelligence
2017 PHAR: Childhood Obesity
Childhood obesity is a serious problem confronting both the current generation and also future generations, since the consequences of childhood obesity impact both on the individuals affected, and also on the wider society as we battle to make our stretched healthcare resources work effectively. Obesity harms children’s physical and emotional health in their childhood and is likely to go on to harm their adult health, cutting short lives and placing further strain on our health services. There are things that everyone can do to improve the situation – this is a problem that will need the coordinated actions of central and local governments, schools, food producers and providers, employers, and not least parents and children.
2017 PHAR: Childhood Obesity
Changes in the weight status of children between the first and final years of primary school
A longitudinal cohort analysis of data from the National Child Measurement Programme (NCMP) covering children in England between reception (aged 4 to 5 years old) in academic year 2013 to 2014 and year 6 (aged 10 to 11 years old) in academic year 2019 to 2020.
Changes in the weight status of children between the first and final years of primary school
Report
OHID Fingertips – Obesity profile
Tackling obesity is one of the greatest long-term health challenges currently faced in England. Around two-thirds (63%) of adults are above a healthy weight, and of these half are living with obesity. In England 1 in 3 children leaving primary school are overweight or living with obesity with 1 in 5 living with obesity. Obesity prevalence is highest amongst the most deprived groups in society. Children resident in the most deprived parts of the country are more than twice as likely to be living with obesity than those in the least deprived areas. Obesity is associated with reduced life expectancy and a range of health conditions including type 2 diabetes, cardiovascular disease, liver and respiratory disease and cancer. Obesity can also have an impact on mental health
OHID Fingertips – Obesity profile
Dataset
OHID Fingertips – Physical activity tool
The Physical Activity tool is part of a series of products produced by Public Health England providing local data alongside national comparisons to support local health improvement. The tool brings together data for the whole of England on physical activity, including walking and cycling, as well as data on related risk factors and conditions such as obesity and diabetes. The tool presents data at local level to help promote physical activity, develop understanding, and support benchmarking, commissioning and service improvement.
OHID Fingertips - Physical activity tool
Dataset
NHS England - National Child Measurement Programme
Reports on the Government's National Child Measurement Programme (NCMP) for England. This programme is part of the Government’s approach to tackling child obesity by annually measuring the height and weight of children in reception (aged 4–5 years) and year 6 (aged 10–11 years) in mainstream state-maintained schools in England.
NHS England - National NCMP data sets - current and historic
Website
OHID - Adult obesity: applying All Our Health
This guide is part of ‘All Our Health’, a resource which helps health professionals prevent ill health and promote health and wellbeing as part of their everyday practice. The information below will help front-line health and care staff use their trusted relationships with patients, families and communities to promote the benefits of achieving and maintaining a healthy weight.
OHID – Adult obesity: applying All Our Health
Report
World Health Organization - Obesity
Overweight and obesity are defined as abnormal or excessive fat accumulation that presents a risk to health. A body mass index (BMI) over 25 is considered overweight, and over 30 is obese. The issue has grown to epidemic proportions, with over 4 million people dying each year as a result of being overweight or obese in 2017 according to the global burden of disease.
World Health Organization - Health topic: Obesity
Website
IHME – Global burden of disease
The Global Burden of Disease (GBD) study provides a comprehensive picture of mortality and disability across countries, time, age, and sex. It quantifies health loss from hundreds of diseases, injuries, and risk factors, so that health systems can be improved and disparities eliminated.
IHME – Global burden of disease
Visualisation
PLOS Medicine - Associations between trajectories of obesity prevalence in English primary school children and the UK soft drinks industry levy: An interrupted time series analysis of surveillance data
Sugar-sweetened beverages (SSBs) are the primary source of dietary added sugars in children, with high consumption commonly observed in more deprived areas where obesity prevalence is also highest. Associations between SSB consumption and obesity in children have been widely reported. In March 2016, a two-tier soft drinks industry levy (SDIL) on drinks manufacturers to encourage reformulation of SSBs in the United Kingdom was announced and then implemented in April 2018. Examination of trajectories in the prevalence of obesity at ages 4 to 5 years and 10 to 11 years, 19 months after the implementation of SDIL, overall and by sex and deprivation.
PLOS Medicine - Associations between trajectories of obesity prevalence in English primary school children and the UK soft drinks industry levy: An interrupted time series analysis of surveillance data
Report
OHID - Excess Weight and COVID-19
This report provides evidence-based insights on the relationship between excess weight and COVID-19. Evidence has been brought together from UK and international studies published during the pandemic. These have been identified using a pragmatic methodology; the report is not a systematic review. Findings have been contextualised with information on the prevalence, causes, and risks of excess weight. Information on food and drink purchases and physical activity during lockdown is also included.
OHID – Excess weight and COVID-19
Report
Last updated: 09 January 2025