Mortality
 Mortality overview
Assessing the number and rate of deaths (or mortality) in any population is important in understanding and monitoring the health status of a whole community. Understanding the underlying causes of mortality, the prevalence and trends in premature (deaths before 75 years of age) and preventable mortality (causes of death that can be mainly avoided through effective public health and primary prevention interventions) are particularly important, with preventable mortality being a priority area in the Southampton 2017-25 Health and Wellbeing Strategy.
In the UK, deaths must be reported to the Local Registration Service, in partnership with the General Register Office (GRO). This is a legal requirement as set out in the Births and Deaths Registration Act (1836). The coding used for cause of death is carried out according to the World Health Organization (WHO) International Classification of Diseases (ICD-10) and internationally agreed rules, allowing for international comparisons.
Numbers of deaths represent the number of registered deaths in a population but, because there can be registration delays including those deaths requiring a coroner’s verdict, deaths by date of registration may include deaths that occurred months or even years earlier. Deaths for Southampton include resident deaths that occur outside Southampton.
Benchmarking and trends data along with sub-city analysis uses ONS Mid-Year Estimate population to calculate rates. Please note ward and locality city values may vary to deprivation city values due to 2023 electoral ward boundary changes.
More information is available in the mortality dashboard available below and in the resources section.
Life expectancy and mortality dashboard
Visualisation
Mortality in Southampton
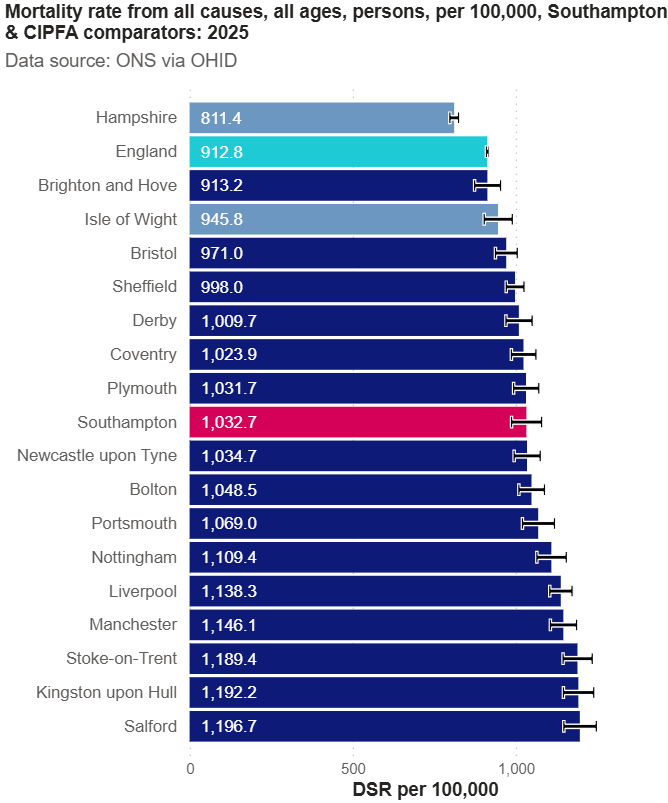 In 2025, there were 1,979 deaths registered in Southampton, a directly age standardised rate (DSR) of 1,033 deaths per 100,000 population, which is significantly worse than the England average of 913 per 100,000. Southampton has the 7th lowest mortality rate amongst its CIPFA comparator group (16 local authorities).
In 2025, there is a DSR of 1,221 per 100,000 population for males (1,031 deaths), significantly worse than the England rate of 1,071 DSR per 100,000 population. Southampton is ranked 8th lowest male mortality among the CIPFA comparator group. For females, the DSR was 876 per 100,000 population (948 deaths), which is significantly worse than the England average (782 DSR per 100,000) and the 6th lowest among the CIPFA comparator group.
Please note, 2025 data is using provisional mortality and population data.
For a 3-year pooled period, between 2001-03 and 2009-11, the mortality rate for persons had been decreasing slightly faster in Southampton than in England. However, since 2009-11, the England rate has continued to decrease whilst the Southampton rate has increased. In both England and Southampton, a rise was seen in mortality from 2017-19 to 2020-22. This is likely due to the start of the COVID-19 pandemic. Since 2020-22, mortality rates have declined in both England and Southampton, with a quicker decrease in England. More information on the impact of COVID-19 can be found in the COVID-19 impact assessment.
Mortality varies at a sub-city level for 2022-24 from a DSR of 740 per 100,000 MYE population in Bassett ward to 1,558 DSR per 100,000 MYE population in Banister & Polygon ward, with the city average of 1,057 DSR per 100,000 MYE population. Central locality has the highest DSR of 1,448 per 100,000. The following sections illustrate how mortality varies by age and deprivation.
More information is available in the mortality dashboard available below and in the resources section.
Life expectancy and mortality dashboard
Visualisation
Mortality by age
In Southampton, in 2022-24 (pooled), the number of stillbirths (those infants that died in the womb after having survived through at least the first 24 weeks of pregnancy) was 3.3 per 1,000 births, which is lower, but not significantly, to the England average (3.9 per 1,000 births). This is a small increase for Southampton from 2.9 per 1,000 births in 2021-23 and is the 2nd lowest among children’s comparators.
The neonatal mortality rate (deaths under 28 days) for Southampton, in the same period, was 1.9 per 1,000 births, which is lower, but not significantly, to the England average (3.1 per 1,000 births) and the lowest among children’s comparators. The post-neonatal mortality rate (deaths between 28 days and 1 year) for Southampton, was a crude rate of 1.2 per 1,000 births, similar to the England rate of 1.1 per 1,000 births and the 4th lowest among children’s comparators. Southampton’s rate has been increasing since 2020-22 whilst England’s rate has stayed the same.
Infant mortality (deaths under 1 year of age) in Southampton is 3.1 per 1,000 births in 2022-24, lower, but not significantly, than the England average of 4.2 per 1,000. Southampton infant mortality had been increasing from 2012-14, yet since 2019-21, the rate has been decreasing. In comparison, the England average has remained consistent between 3.9 and 4.0 per 1,000 births between 2012-14 and 2019-21 and has since slightly increased.
The all cause child mortality rate (deaths of a child between the ages of 1 and 17 years) in Southampton in 2022-24 was 14.0 DSR per 100,000 persons, higher, but not significantly, to the England average (11.6 per DSR per 100,000 persons). Southampton is the 3rd highest among its children’s comparator group. Both England and Southampton have increased since 2020-22, with Southampton at a faster rate than England.
In 2024, 42.3% of deaths in England occurred in hospital, making it the most common place of death. However, nearly 58% of deaths occurred in community settings, with home deaths (28.1%) and care homes (21.5%) accounting for the majority. Care home deaths are most common in ages 85+ with 35.9% of deaths, reflecting increasing frailty, increase in dementia prevalence and long term residential care use. Younger adults are more likely to die at home with 36.6% of home deaths in under 65s.
More information is available in the mortality dashboard available below and in the resources section.
Life expectancy and mortality dashboard
Visualisation
Mortality by deprivation
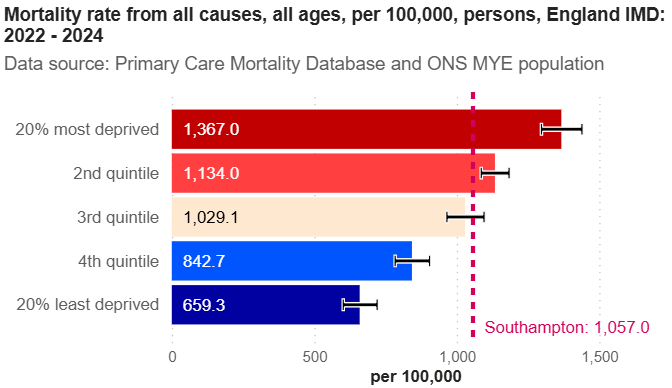 Within the city, mortality rates for England and Southampton deprivation quintiles are statistically significantly higher and around 2.0 times higher in the 20% most deprived areas compared to the 20% least deprived areas for persons, males and females in 2022-24.
Under 75 mortality by England deprivation quintiles is 2.7 times higher in the 20% most deprived areas in Southampton compared to the 20% least deprived (572 compared to 209 DSR per 100,000 population). For males this is a difference of 2.6 times higher (701 compared to 272 DSR per 100,000 population), whilst for females the difference is 3.1 times higher (446 compared to 145.8 DSR per 100,000 population).
More information is available in the mortality dashboard available below and in the resources section.
Life expectancy and mortality dashboard
Visualisation
Underlying causes of mortality
 The underlying cause of death is most often used to understand more about patterns and trends in mortality among a particular population. The underlying cause of death is defined by the World Health Organization as “the disease or injury which initiated the train of morbid events leading directly to death, or the circumstances of the accident or violence which produced the fatal injury”.
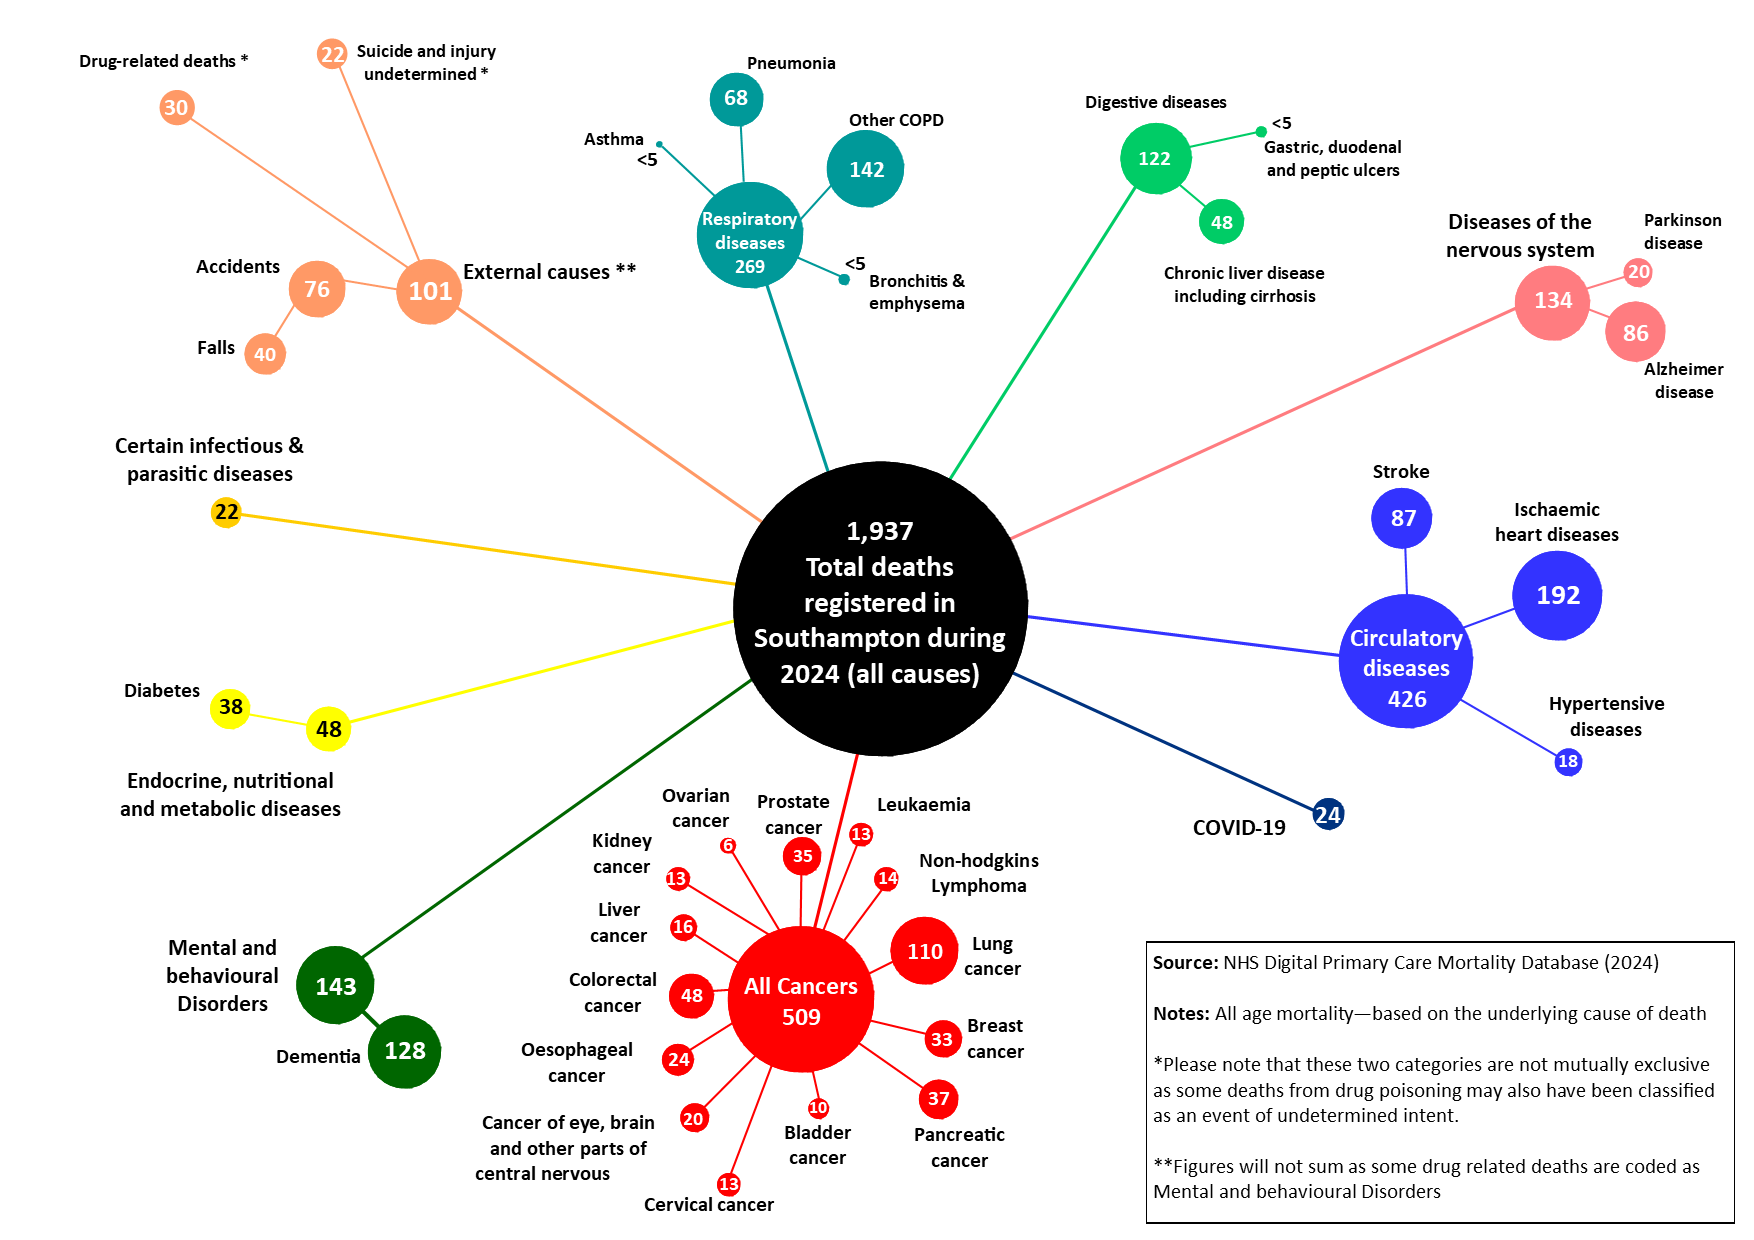
When looking at the 1,937 deaths grouped by underlying cause in Southampton for 2024 it was found that:
- The three main causes were:
- Cancer - 509 deaths (26.3%)
- Circulatory diseases - 426 deaths (22.0%)
- Respiratory diseases - 269 deaths (13.9%)
- Lung cancer accounted for 5.7% of all deaths and 21.6% cancer deaths (110 deaths)
- 1% of circulatory disease deaths were caused by Ischemic heart diseases, also known as coronary heart disease (192 deaths)
- 8% of all respiratory disease deaths were attributed to other COPD (142 deaths)
- COVID-19 was responsible for 1.2% (24) deaths in 2023, an 89.9%, decrease from 2021 deaths (237 COVID deaths)
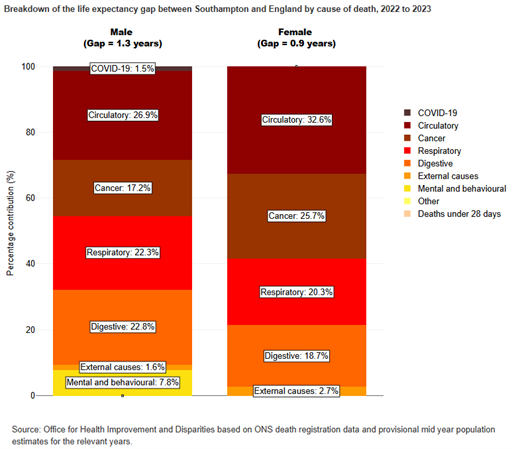 The Office for Health Improvement and Disparities (OHID) have produced an inequalities segment tool which shows the relative contribution that nine broad causes of death have on the gap between life expectancy for Southampton and that for England for the 2022 to 2023 period.
Circulatory (26.9%), digestive (22.8%) and respiratory (22.3%) disease deaths are the largest groups contributing to the gap in male life expectancy between Southampton and England with heart disease being the highest detailed caused, followed by chronic lower respiratory diseases and cirrhosis & liver disease.
For females, circulatory diseases (32.6%), cancer (25.7%) and respiratory (20.3%) deaths are the largest groups contributing to the gap in life expectancy. As with males, heart disease is the highest detailed cause, followed by chronic lower respiratory diseases and other cancer.
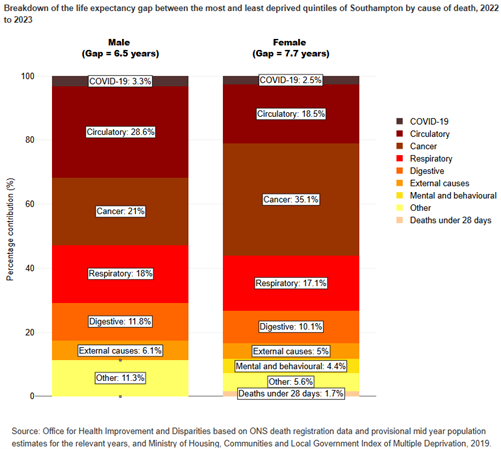 The gap in life expectancy can also be analysed by the most and least deprived quintiles in Southampton. Circulatory disease (28.6%), cancer (21.0%) and respiratory (18.0%) deaths are the largest groups contributing to the gap in male life expectancy between the most and least deprived quintiles in Southampton. On closer inspection, the two largest causes are heart disease followed by chronic lower respiratory disease.
For females, cancer (35.1%) is the largest cause contributing to the gap in female life expectancy between the most and least deprived quintiles in Southampton, followed by circulatory diseases (18.5%) and respiratory diseases (17.1%). More detailed analysis shows the single largest cause of the gap in female life expectancy is other cancer, followed by chronic lower respiratory diseases and lung cancer. COVID-19 contributed 3.3% to the gap in male life expectancy and 2.5% to the gap in female life expectancy.
More information is available in the mortality dashboard available below and in the resources section.
Life expectancy and mortality dashboard
Visualisation
Preventable mortality
 Preventable mortality is defined as causes of death that can be mainly avoided through effective public health and primary prevention interventions (for example improvement of healthy behaviours to reduce the chance of disease).
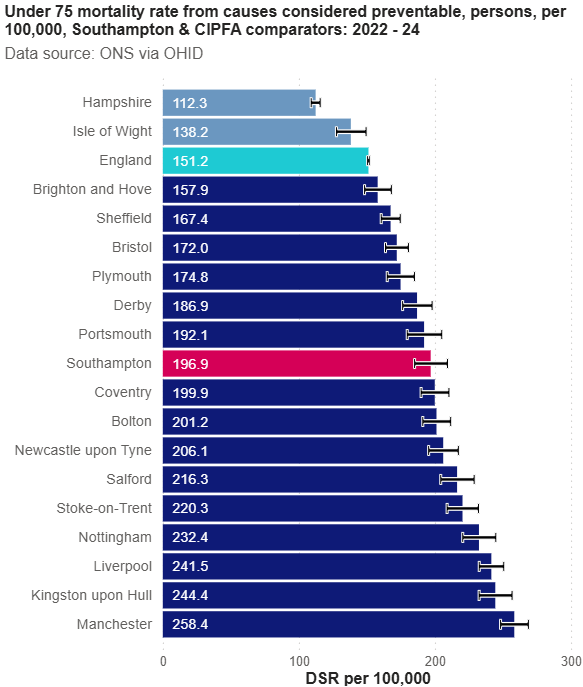
In Southampton, under 75 mortality from causes considered preventable, was 196.9 DSR per 100,000 population in the period 2022-24 (pooled), significantly worse than the England average (151.2 DSR per 100,000 population) and the 7th lowest among our CIPFA comparators.
The rate for males and females is also significantly worse than the England average, with a DSR of 263.1 per 100,000 for males (compared to 200.2 for England) and 131.0 per 100,00 for females (compared to 104.9 for England)
Between 2001-03 and 2014-16, both England and Southampton experienced declining rates. Southampton’s rate then started to increase while England continued decreasing until 2017-19. Following this period, both England and Southampton’s rates increased significantly up to 2020-22, likely attributable to the COVID-19 pandemic. Thereafter, rates decreased, approaching levels observed prior to the pandemic.
More information is available in the mortality dashboard available below and in the resources section.
Life expectancy and mortality dashboard
Visualisation
Years of life lost
Not only is it important to consider the number of deaths from each underlying cause, but also the impact of each death. One way of measuring this is through calculating the number of life years lost.
 Years of life lost (YLL) is a measure of the average time a person would have lived had they not died before the age of 75 years. This data helps measure the social and economic loss from dying younger and highlights the specific causes of death affecting younger people such as suicide and accidents.
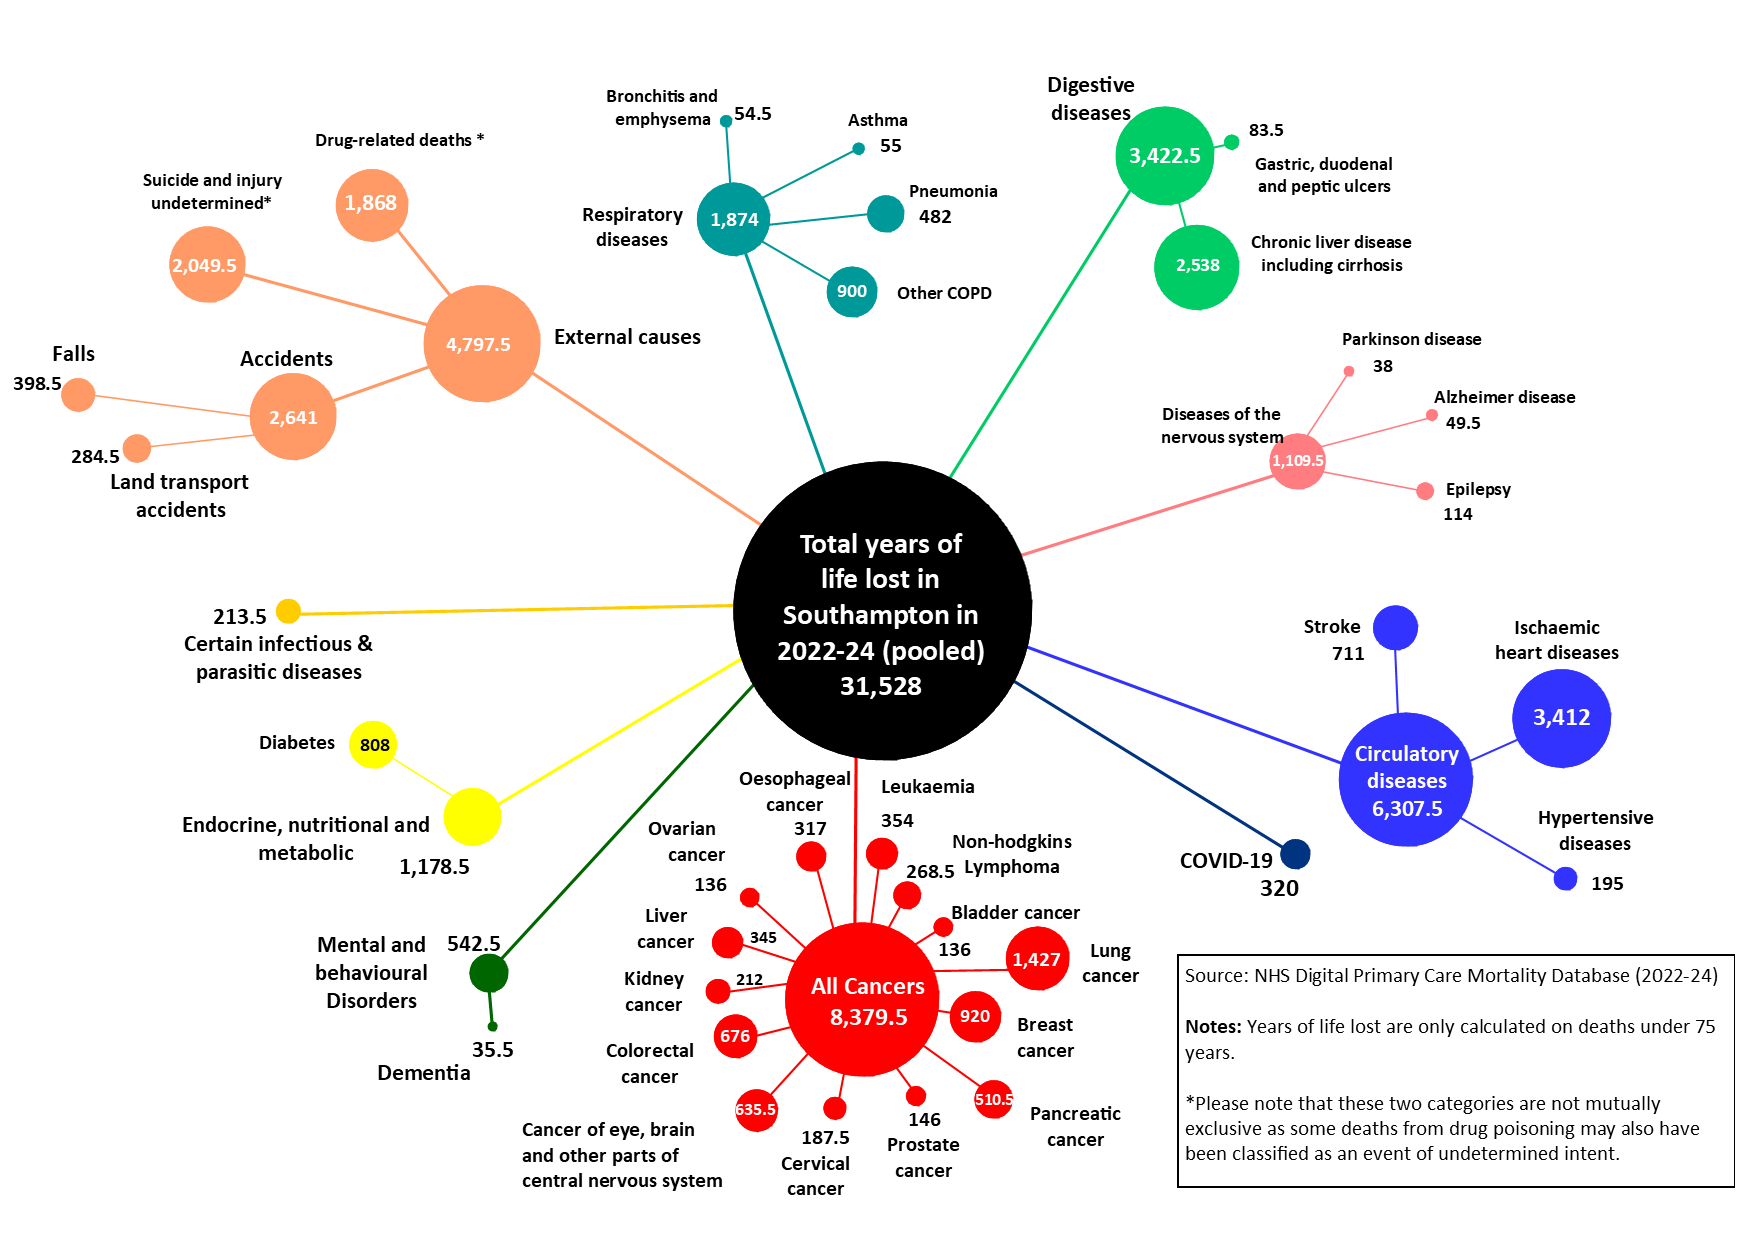
In the period 2022-24 (pooled), 31,528 years of life were lost for Southampton residents aged under 75 years. During this period:
- Cancer (26.6%), circulatory diseases (20.0%) and external causes (15.2%) together accounted for over 60% of all years of life lost
- 8,379.5 years of life were lost due to cancer. The two highest contributing types of cancer were:
- Lung cancer; 1,427 years of life lost (17.0% of years lost to cancer deaths)
- Breast cancer; 920 years of life lost (11.0% of years lost to cancer deaths)
- 6,307.5 years of life were lost due to circulatory diseases. The highest contributing type was:
- Coronary heart disease (also known as ischemic heart disease); 3,412 years of life lost (54.1% of years lost to circulatory disease deaths)
- 2,049.5 years of life were lost due to suicide and injury undetermined (6.5%)
- 1,874 years of life were lost due to respiratory diseases of which 900 (48.0% of respiratory deaths) were other COPD
More information on causes of mortality and years of life lost can be found in the resources section below, whilst analyses of the causes of mortality which contribute most to inequalities in life expectancy in Southampton can be seen in the life expectancy and health inequalities pages.
Resources
Life expectancy and mortality dashboard
The life expectancy and mortality dashboard present a range of data regarding life expectancy and mortality, to provide intelligence to help drive strategic decision making. Analysis includes benchmarking against statistical neighbours and trends over time for all indicators included. Some indicators include analysis at sub-city levels, by Southampton wards, primary care networks (PCNs) and deprivation quintiles.
Life expectancy and mortality dashboard
Visualisation
GOV.UK - Palliative and end of life care
Information and resources for health and social care professionals to improve the quality of services and reduce inequalities in care.
Palliative and end of life care
Dataset
Mortality bubble charts
Below are two bubble charts showing all cause mortality and the number of years of life lost. In these charts the size of the bubble is proportionate to the number of deaths and years of life lost.
2024 Mortality Bubble Diagram
YLL Bubble Diagram 2022 2024
OHID Fingertips - Mortality profile
The Mortality Profile brings together a selection of mortality indicators, including from other OHID data tools such as the Public Health Outcomes Framework, making it easier to assess outcomes across a range of causes of death.
OHID fingertips tool - Mortality profile
Dataset
OHID – Segment tool
This tool provides information on the causes of death and age groups that are driving inequalities in life expectancy at local area level. Targeting the causes of death which contribute most to the life expectancy gap should have the biggest impact on reducing inequalities.
OHID - Life expectancy segment tool
Dataset
ONS - Deaths broken down by age, sex, area and cause of death
Data on deaths broken down by age, sex, area and cause of death.
ONS – Deaths, broken down by age, sex, area and cause of death
Report
ONS - Child and infant mortality in England and Wales
Information on stillbirths, infant and childhood deaths occurring annually in England and Wales, and associated risk factors.
Child and infant mortality in England and Wales
Report
IHME – Global Burden of Disease (GBD)
The Global Burden of Disease (GBD) study provides a comprehensive picture of mortality and disability across countries, time, age, and sex. It quantifies health loss from hundreds of diseases, injuries, and risk factors, so that health systems can be improved and disparities eliminated.
IHME – Global Burden of Disease (GBD)
Visualisation
Last updated: 22 May 2026