Locality profiles
Southampton Locality Profiles
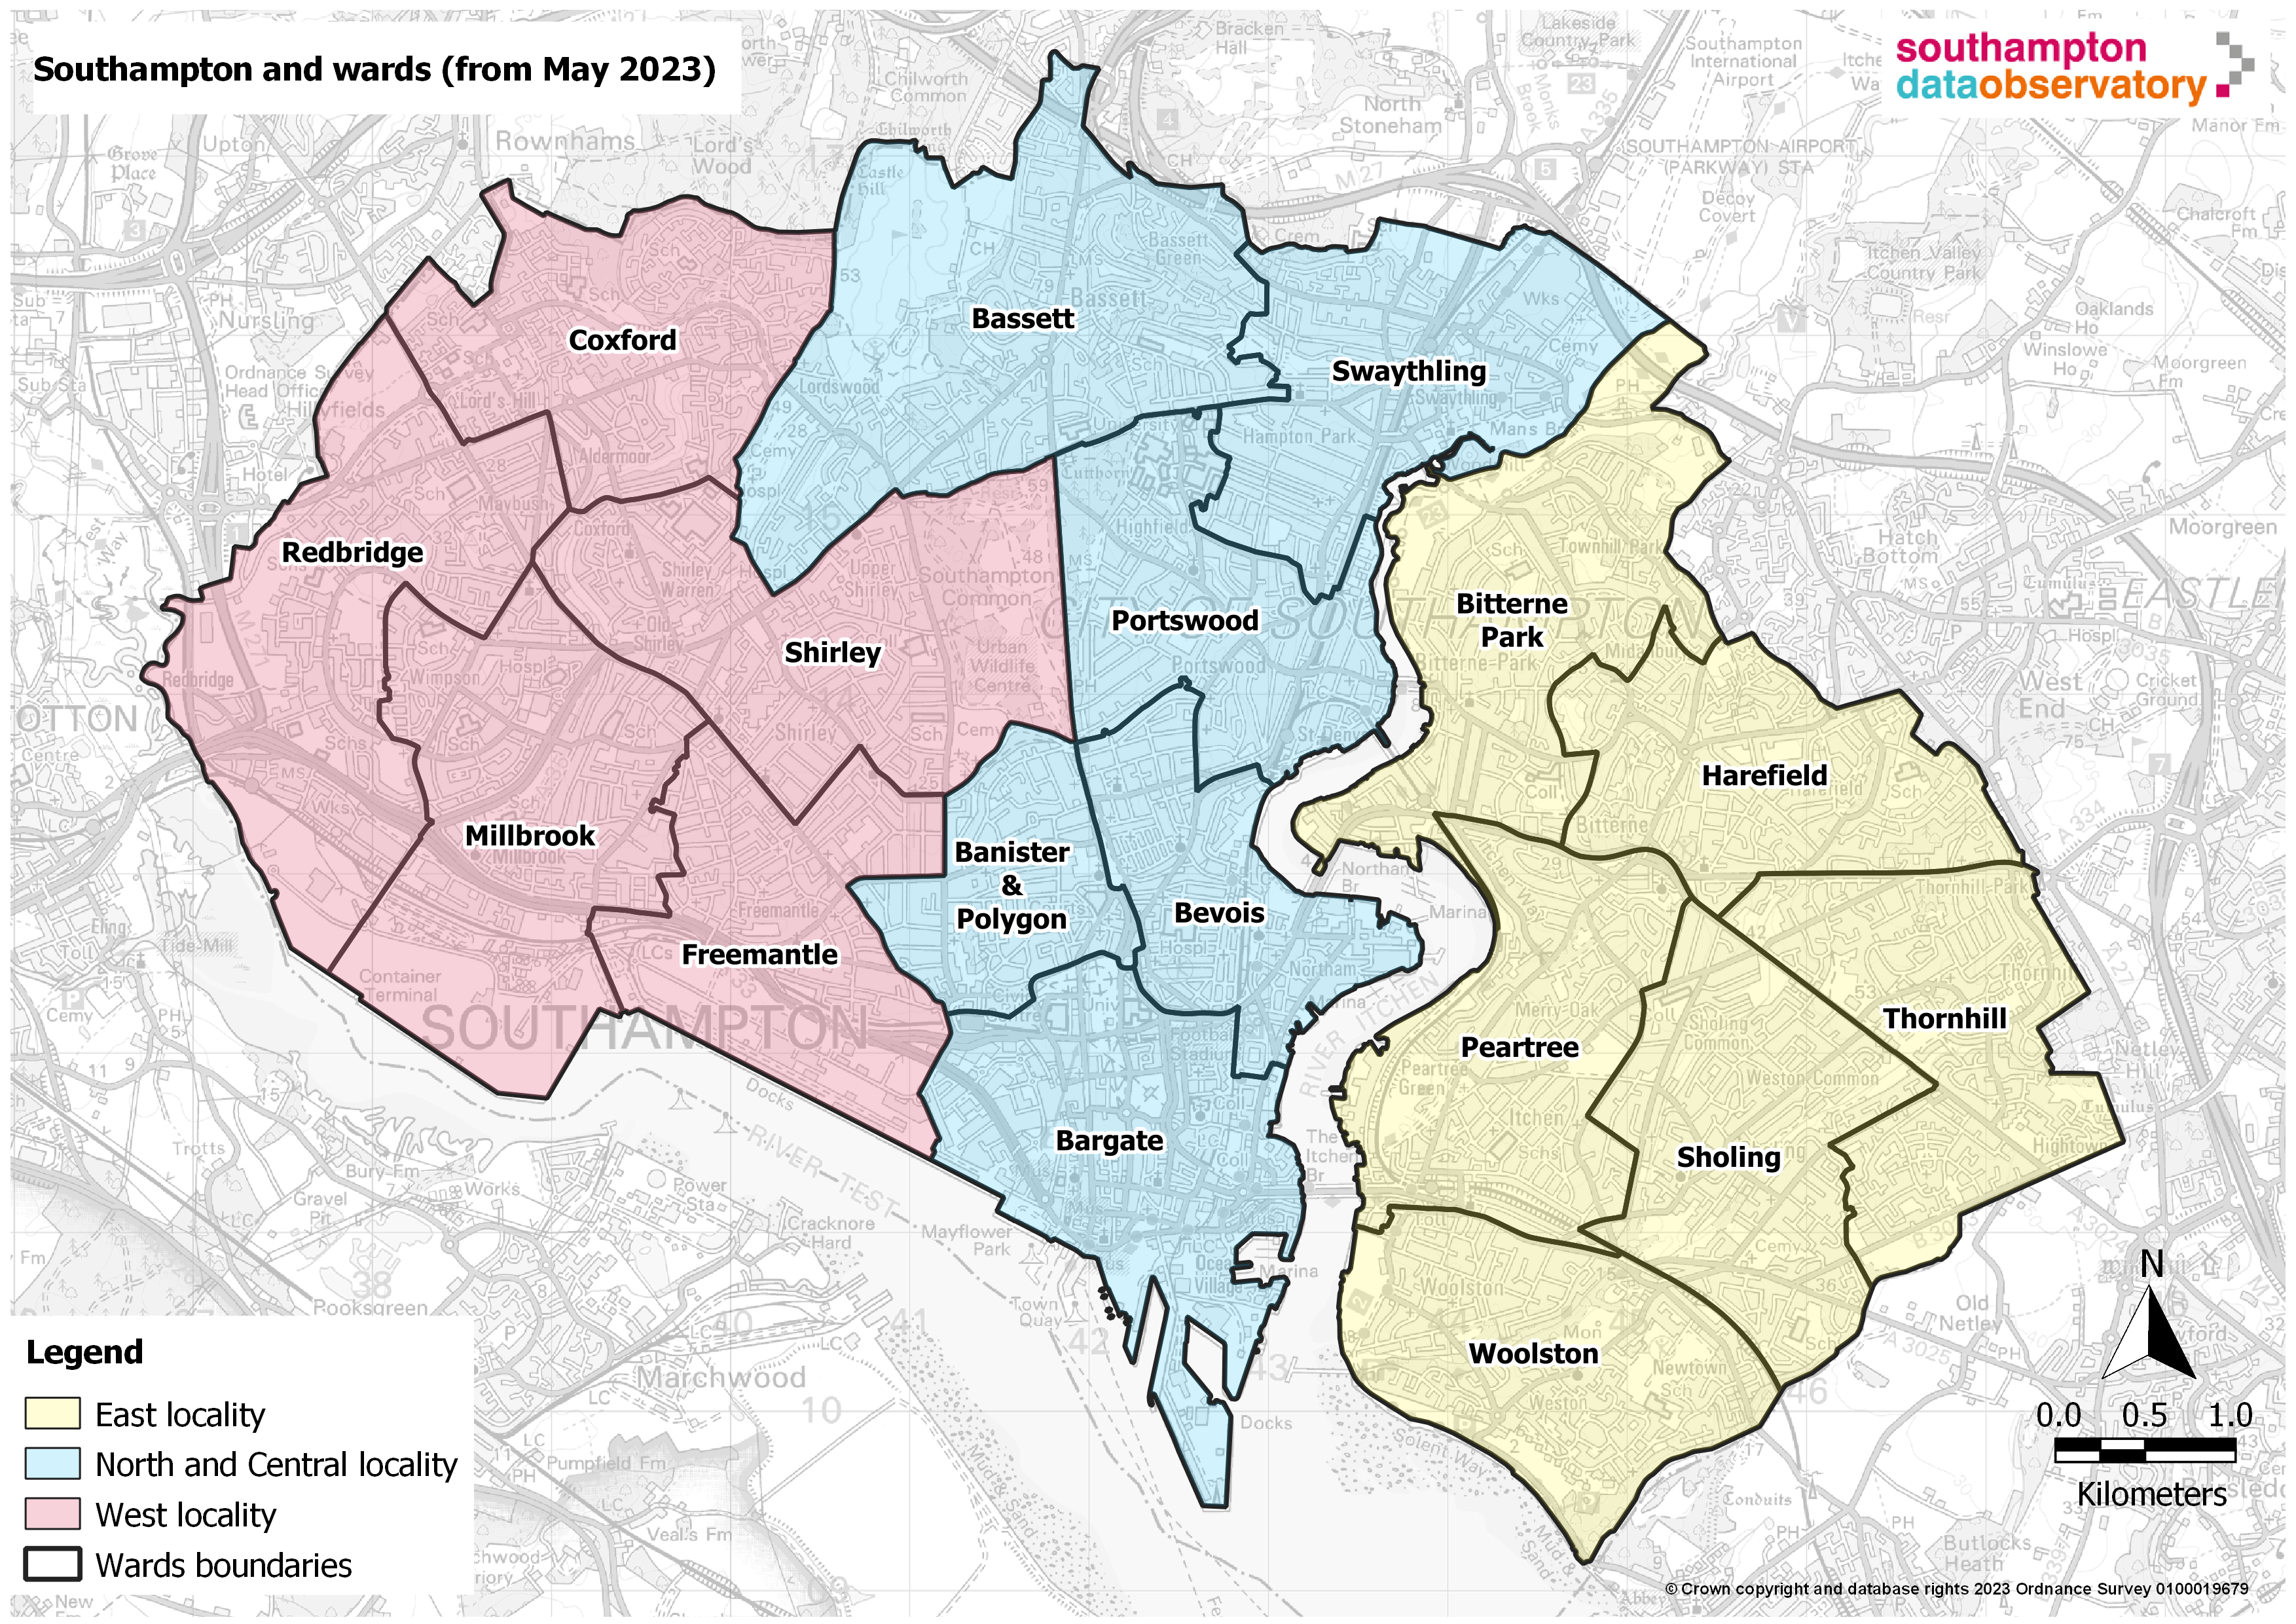
 Localities refer to an aggregation of wards, which are a smaller geography. In Southampton, wards are grouped into three localities:
- West: Coxford, Freemantle, Millbrook, Redbridge and Shirley
- North & Central: Banister & Polygon, Bargate, Bassett, Bevois, Portswood and Swaythling
- East: Bitterne Park, Harefield, Peartree, Sholing, Thornhill and Woolston
 Locality profiles have been produced for the three localities in Southampton, to meet the need for information and intelligence at the local level in the city and form part of the Single Needs Assessment for Southampton. These profiles pull together information across a range of topics to better understand the local population need at sub-city geographies.
It should be emphasised that as localities are a larger sub-city geography, examining information at a locality level may mask inequalities. Therefore, it is important to consider the variation across wards and neighbourhoods within localities. However, localities are a useful geography for service design and to inform commissioning.
The locality profiles are part of the interactive geographical profiles Power BI dashboard linked below. This dashboard provides data for a range of indicators grouped into various topics, including demography, economy, community safety, health, education and social care.
Geographical profiles dashboard
Visualisation
Resources
Geographical profiles dashboard
This dashboard provides profiles for neighbourhoods, electoral wards and localities in Southampton. These profiles have been produced to meet the need for information and intelligence at the local level in the city and form part of the Single Needs Assessment for Southampton. These profiles pull together information across a range of topics including demography, economy, community safety, health, education and social care to better understand the local population need at sub-city geographies.
Geographical profiles dashboard
Visualisation
Geographies dashboard
This dashboard draws together a selection of interactive maps on various topics all in one place. These maps range from geographical boundary maps and points of interest for Southampton.
Geographies dashboard
Visualisation
Southampton population dashboard
The dashboard presents a range of population data to provide intelligence on Southampton's resident and GP registered population to help drive strategic decision making. Data in this dashboard is compiled from a range of publicly available sources. Including Small Area Population Forecasts (SAPF), Mid-Year Population Estimates (MYE), Subnational Population Projections (SNPP) and GP Registered Populations. Please note that SAPF figures in the dashboard are the sum of all Lower Level Super Output Areas (LSOAs) and may not be the same as other published figures.
Southampton population dashboard
Visualisation
Locality health data packs
Locality health data packs provided a detailed summary of the population health within each locality using tables, charts and infographics. Data is presented at locality level, although variations by GP practice are also shown to highlight any differences within the locality. This is important as just examining information at locality level can mask inequalities within a locality. The data packs can be downloaded below. Please note that data presented relates to old Southampton ward boundaries. Analysis is based on pre-2023 ward boundaries.
West locality health data pack
pdf | 17.9 MB | 30.08.2019
North locality health data pack
pdf | 18.0 MB | 30.08.2019
East locality health data pack
pdf | 18.0 MB | 30.08.2019
GP practice and locality spine chart profiling tool
The GP practice and locality spine chart tool summarises 65 indicators across nine themes including, population and demography, life expectancy and mortality, physical health, mental health, health behaviours, healthy start, children and young people, ageing well and wider determinants of health. The spine chart is provided as an easy to use Excel file; simply select the locality or GP practice of interest from the drop down list to display that profile. Detailed guidance and frequently asked questions (FAQs) are provided within the tool. Please note that data presented relates to old Southampton ward boundaries. Analysis is based on pre-2023 ward boundaries.
GP practice and locality spine chart profiling tool
ONS - Subnational indicators explorer
Compare a local authority and the UK average (median) local authority by different indicators, such as weekly pay and healthy life expectancy.
ONS - Subnational indicators explorer
Visualisation
Last updated: 29 February 2024