Population change
Population change
 Understanding how Southampton’s population will change in the future, and how this will affect demand for a range of services, is vital for service planning and commissioning. There are many uncertainties around current and future population numbers. The Small Area Population Forecasts (SAPF) produced by Hampshire County Council provides the best available estimate of how the resident population of the city will change over the short to medium term (currently up to 2030). In addition, long term population projections (currently up to 2043) are available from the Office for National Statistics.
Local population forecasts
 The Small Area Population Forecasts (SAPF) produced by Hampshire County Council cover Hampshire, the local districts and Portsmouth and Southampton. These figures are based on natural change (births and deaths), internal and international migration and known and planned completions of residential dwellings.
In May 2023, there was a ward boundary review, which has resulted in an additional ward being added, covering Banister & Polygon. This gives Southampton 17 wards. Other ward boundaries have changed to accommodate this new ward and Bitterne has been renamed Thornhill.
Data presented in this page, where possible, are to these new ward boundaries and totals are a sum of the male and female population of the wards.
The most recently published data is for the 2023 to 2030 period and forecasts that:
- Southampton’s total resident population is forecast to increase to 284,924 people by 2030, an increase of 7.5% (19,967 people) from 2023
- Within the city, the largest growth is predicted to be in the new ward boundary of Bargate (7,269 people or 37.8%)
- The ward with the lowest population growth is Coxford, with an increase of 1.7% or 254 extra people
- The number of dwellings is forecast to increase from 109,226 in 2023 to 115,944 in 2030; an increase of 6.2% (6,718 extra dwellings)
- The largest growth in dwellings is predicted to be in the new ward boundaries is Bargate (3,465 extra dwellings; 43.3%), followed by Banister and Polygon (557 extra dwellings; 7.8%) and Bitterne Park (473 extra dwellings; 7.0%)
- The smallest growth in dwellings is predicted to be in Coxford (14 extra dwellings 0.2%) between 2023 and 2030
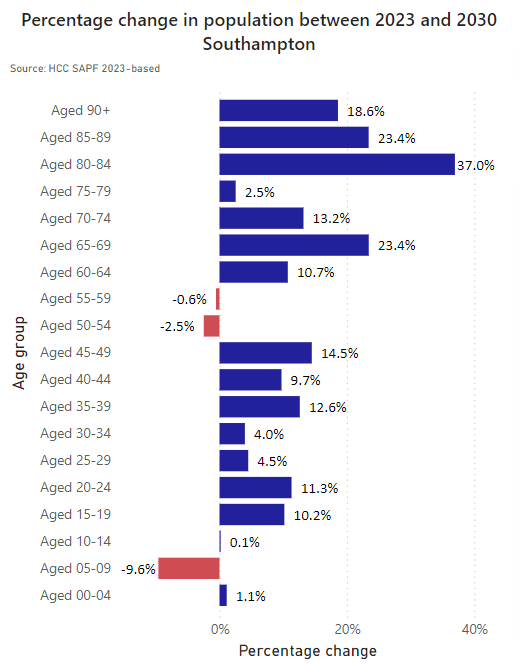
The older population is projected to grow proportionately more than any other group in Southampton in the next few years. The over 65 population is set to increase by 18.2%, or 7,021 people, between 2023 and 2030, with the over 75 population set to increase by 17.9%, or 3,448 people. The proportion of the population of working age is steadily declining potentially impacting productivity and the skill pool of the resident workforce. Combined with the decline locally and nationally in birth rates, there is an expected impact in the informal and community care available for the ageing population in the future. Further analysis into how a growing elderly population in the city may translate into demand for health and social care services has been undertaken locally. More details can be found in the population dashboard and in the resources section below.
Southampton Population dashboard
Visualisation
Subnational population projections (SNPP)
The 2018 based subnational population projections from the Office for National Statistics (ONS), provides data on the potential future size and age structure of the population in Southampton over a longer timeframe. The latest publication projects the population from 2018 to 2043.
The projections take the ONS 2018 mid-year population estimates as their starting point. The projected local authority populations for each year are calculated by ageing on the population from the previous year, applying local fertility and mortality rates to calculate the number of projected births and deaths, and then adjusting for migration into and out of each local authority. Derived local authority fertility, mortality and migration assumptions use estimated values from the five years before the base projection year.
Using these projections the population of Southampton is predicted to rise by 7.1% between 2018 and 2043. This is an increase of 18,038 people from 252,796 people in 2018 to 270,834 people in 2043. The population aged between 15 and 24 is predicted to increase by 4,580 (9.3%) people over the same period. The over 65 population is predicted to increase by 35.0% or 11,715 people from 33,508 in 2018 to 45,223 in 2043. The over 90 population is predicted to rise by 67.8% percent from 1,804 in 2018 to 3,028 in 2043.
More information is available in the resources section below.
Resources
Population dashboard
The dashboard presents a range of population data to provide intelligence on Southampton's resident and GP registered population to help drive strategic decision making. Data in this dashboard is compiled from a range of publicly available sources. Including Small Area Population Forecasts (SAPF), Mid-Year Population Estimates (MYE), Subnational Population Projections (SNPP) and GP Registered Populations. The compendium also contains information on languages spoken in schools and ethnic groups of school pupils.
Southampton population dashboard
Visualisation
Hampshire County Council Small Area Population Forecasts (SAPF)
The Small Area Population Forecasts (SAPF) are produced by Hampshire County Council and cover Hampshire, the local districts, Portsmouth and Southampton. These figures are based on natural change (births and deaths), internal and international migration and known dwelling completions. They also include future dwellings supply based on residential planning applications. The SAPF data is available for Local Authorities, wards and Lower Level Super Output Areas (LSOA), allowing the creation of defined smaller areas or community data.
Hampshire County Council Small Area Population Forecasts (SAPF)
Dataset
ONS - Subnational Population Projections (SNPP) for England
The 2018-based subnational population projections provide statistics on the potential future size and age structure of the population in England at region, county, local authority, clinical commissioning group and NHS England region levels. They are used as a common framework for informing local-level policy and planning as they are produced in a consistent way. The projections take the ONS 2018 mid-year population estimates as their starting point. The projected local authority populations for each year are calculated by ageing on the population from the previous year, applying local fertility and mortality rates to calculate the number of projected births and deaths, and then adjusting for migration into and out of each local authority. Derived local authority fertility, mortality and migration assumptions use estimated values from the five years before the base projection year.
ONS - Subnational Population Projections for England: 2018-based
Dataset
ONS - Variant national population projections for the UK and subnational population projections and household projections for England: user guide
Report
Predicting demand for services and adult social care in Southampton analysis
In the context of an ageing population, increases in morbidity (ill health) and a reduction in resources, there is a need to better understand how this could impact on future demand for health and social care services in Southampton. As a result, an analysis was undertaken in 2022 to model and project the number of Southampton residents with chronic health conditions in the future, and how this may translate into demand for local services. The slide set below summarises the findings of this analysis.
Current and predicted chronic conditions and predicted need for help - October 2022
pdf | 14.8 MB | 17.10.2022
Last updated: 16 July 2024