Cardiovascular disease (CVD)
 Overview of cardiovascular disease (CVD)
Cardiovascular disease known as CVD is related to problems with the heart or blood vessels. It is one of the main causes of death and disability in the UK, but it can often largely be prevented by leading a healthy life. Conditions covered within CVD include stroke, coronary heart disease and hypertension.
The Global Burden of Disease tool shows that cardiovascular disease is the second highest ranking disease in Southampton for deaths and disability adjusted life years (DALYs) for all ages and rises to the highest rank for those aged 70 and over. A DALY is defined by the World Health Organisation (Disability-adjusted life years) as a time-based measure that combines years of life lost due to premature mortality (YLLs) and years of life lost due to time lived in states of less than full health, or years of healthy life lost due to disability (YLDs).
Risk factors of cardiovascular disease
Many risk factors of cardiovascular disease (CVD) are linked. This means that if you have one of the risk factors you are also likely to have others. Information from the NHS (CVD) website suggest the key factors are:
- Hypertension: High blood pressure is a key risk factor for CVD
- Smoking (or other tobacco use): The toxins in tobacco can damage and narrow coronary arteries, making them more vulnerable to coronary heart disease (more information can be found on the Smoking page)
- High blood cholesterol: Which can cause arteries to narrow and increase the risk of developing a blood clot
- Diabetes: Both type 1 and type 2 (more information on Diabetes can be found on the Diabetes page)
- Poor diet: A high fat diet can speed up the formation of fatty deposits inside arteries, leading to both high blood cholesterol levels and high blood pressure
- Lack of exercise: People who don't exercise regularly usually have higher cholesterol, higher blood pressure and higher stress levels (more information can be found on the Physical activity page)
- Being overweight: Increases the risk of developing diabetes and high blood pressure (more information can be found on the Healthy weight page)
- Excessive alcohol consumption: Which can lead to increases in both cholesterol levels and blood pressure (more information can be found on the Alcohol page)
- Stress: Increases in blood pressure and the hormones associated with stress are thought to also increase blood glucose levels
- Family history: People with a family history of CVD are more likely to develop it
- Ethnicity: Afro-Caribbean and South Asian communities are at higher risk of CVD, the likely causes are multifactorial and not fully understood. For more information see the British Heart Foundation website or the Ethnicity page
More information on CVD is available in the cardiovascular disease (CVD) dashboard below and in the resources section at the end of the page.
Cardiovascular disease dashboard
Visualisation
Hypertension
 Hypertension or high blood pressure rarely has noticeable symptoms. But, according to the NHS website (hypertension), if untreated it can increase the risk of serious problems such as heart attacks and strokes. Around a third of adults in the UK have high blood pressure, although many will not realise it.
Part of the Core20PLUS5 approach from the NHS, which is to inform action to reduce healthcare inequalities at both national and system level. The approach focuses the healthcare offer for people who live in areas that are the 20% most deprived, as well as ‘PLUS’ population groups identified locally as most likely to be experiencing inequalities, and ‘5’ clinical areas requiring accelerated improvement. One of these five areas is hypertension.
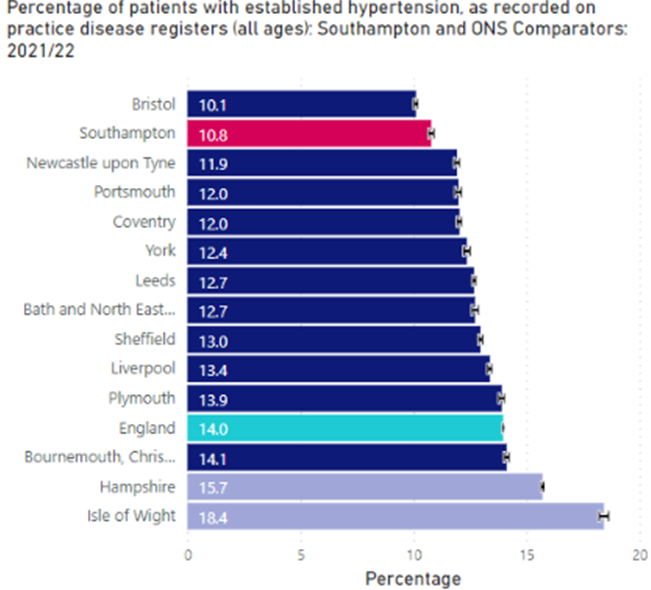
Hypertension is estimated to be present in a third of the adult population. In Southampton, the known prevalence for 2021/22 is 10.8% or 32,550 patients. Lower when compared with 14.0% in England and ranks Southampton as the 2nd lowest amongst our ONS comparators with only Bristol lower at 10.1%. Bournemouth, Christchurch and Poole is the highest at 14.1% of patients. This does not necessarily mean Southampton population has a lower prevalence of high blood pressure as it could be due to many cases being unidentified in the population.
The Office for National Statistics looked at undiagnosed hypertension, using the definition as having a measured blood pressure of 140 over 90 millimetres of mercury (mmHg) or above, or self-reporting a hypertension diagnosis.
In England, it is estimated that 32% of adults living in private households had high blood pressure (hypertension) and 3 in 10 of those (29%) were undiagnosed; this equates to approximately 4.2 million adults with undiagnosed hypertension.
Using these estimates from ONS, suggest that for every 7 adults diagnosed with hypertension there another 3 adults who are undiagnosed.
Work carried out to look at the distribution and forecasting of hypertension suggest that there could be an increase of Equivalent to 0.002% increase per year / 212 more cases by 2028 vs fixed prevalence forecast. There is a higher prevalence of hypertension within the East side of the city, however, the top areas with the highest prevalence are spread across Southampton. The highest prevalence rate is in Coxford ward. Further information on hypertension distribution is available on the Chronic conditions projections page and in the presentation on chronic conditions in the resources section below.
More information on hypertension is available in the CVD dashboard below and in the resources section at the end of the page.
Cardiovascular disease dashboard
Visualisation
Smoking
The toxins in tobacco can damage and narrow coronary arteries, increase the risk of blood clots and the inhalation of carbon monoxide (CO) in cigarette smoke significantly reduces the amount of oxygen that can be carried by the blood (ASH website). These factors and others mean that people who smoke are more vulnerable to coronary heart disease.
Smoking and second-hand smoke is one of the biggest risks for respiratory diseases. Around 1 in 6 people (16.8%) in Southampton smoke. Higher when compared with 13.9% in England and 10.0% in Hampshire. More males smoke than females and people who smoke are more likely to be between the ages of 25 and 54. Further information on smoking distribution by ward is available on the Chronic conditions projections page and in the presentation available in the resources section below.
In Southampton, 20.2% of registered patients who smoke live in the 20% most deprived areas compared to just 8.5% of registered patients in the 20% least deprived areas.
More information can be found on the Smoking page.
Cardiovascular disease dashboard
Visualisation
Life expectancy
 In 2018-20, male life expectancy was 78.3 years; significantly lower than England (79.4 years) and 5th lowest out of 12 local authorities in our ONS comparator group. For females, life expectancy at birth was improving (82.5 years); significantly lower than England (83.1 years) and the 7th lowest amongst Southampton’s ONS comparator group.
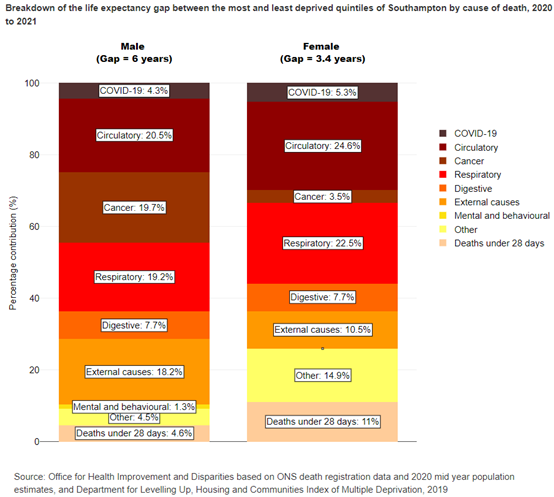
The life expectancy at birth gap between the most deprived 20% of Southampton to the least deprived 20%, is 8.7 years for men and 4.1 years for women (2018-20).
The Office for Health Improvement and Disparities (OHID) inequalities segment tool identifies that circulatory diseases, including stroke, heart disease and CVD deaths contribute 20.5% of the gap in Southampton male life expectancy between the most and least deprived quintiles and is the largest group identified. For females, circulatory diseases contribute 24.6% of the gap in life expectancy between the most and least deprived quintiles, also the largest group identified.
For more information visit the life expectancy page.
Cardiovascular disease dashboard
Visualisation
Prevention programme
CVD can often largely be prevented by leading a healthy life, for example stopping smoking, reducing alcohol intake, maintaining a healthy diet and exercising regularly. Spotting risk factors early reduces the chance of developing potentially life-threatening conditions including heart attacks, stroke and vascular dementia.
Vascular dementia is defined as changes to memory, thinking, and behaviour resulting from conditions that affect the blood vessels in the brain. Cognition and brain function can be significantly affected by the size, location, and number of vascular changes. People with problems with the heart and blood circulation, such as high blood pressure or heart disease, have a higher risk of developing vascular dementia. Which increases the chances of a clot or bleed happening in the blood vessels in the brain. A person who has had a stroke, or who has diabetes or heart disease, is around twice as likely to develop vascular dementia as someone who has not had these conditions. More information is available on the Alzheimer's Society website.
In England, the pandemic has had a significant impact on the detection and management of cardiovascular disease (CVD) and its associated high risk conditions. NHS England’s national approach on CVD Prevention Recovery, sets out four high-impact areas and outlines what this means for local NHS teams and patients.
This involves:
- Prioritising hypertension management, reducing health inequalities and supporting the recovery of CVD prevention after the pandemic
- Supporting people to manage their high blood pressure through the provision of 220,000 home blood pressure monitors and supporting GP practices to integrate home readings into the management of hypertension: NHS England - Home blood pressure monitoring
- Working with community pharmacies to provide blood pressure checks for adults over 40 to help in the identification of undiagnosed hypertension: NHS England - NHS community pharmacy hypertension case-finding advanced service
- Making every contact count by scaling up blood pressure checks in other community settings such as dental settings and vaccination centres
- Helping primary care understand the cardiovascular disease status of their population through the provision of CVDPREVENT reports and an improvement tool
More information on CVD is available in the dashboard below and in the resources section at the end of the page.
Cardiovascular disease dashboard
Visualisation
Health Checks
One of the tools that can help prevent CVD, heart attacks and stroke are NHS Health checks. These health check-ups are for adults in England and are designed to spot early signs of stroke, kidney disease, heart disease, type 2 diabetes or dementia. Invites are sent out to otherwise healthy eligible patients aged between 40 and 74 years, once every five years, to have a check up to assess their risk and then be given support to help them reduce or manage that risk.
During the pandemic, as with many other routine appointments health checks were not offered. This is reflected in the trend data for Southampton which shows a large fall in offered and received health checks in 2020/21. In 2019/20, pre pandemic, Southampton had the highest percentage of people offered a NHS Health Check among our ONS comparators, 23.8%, compared with 17.7% in England. The lowest was Newcastle upon Tyne with just 5.9% of patients being offered a health check. From those who were invited 37.4% took up the offer in that year, which equated to 8.9% of the eligible population.
In Southampton, in the 2022/23 period 28.5% of the eligible population were offered a health check and from those invited 27.0% took up the offer, 5th lowest among our ONS comparator group and lower than the England average of 38.9%. This equated to 7.7% of the eligible population having an NHS Health Check in 2022/23.
More information on NHS Health Checks is available in the dashboard below and in the resources section at the end of the page.
Cardiovascular disease dashboard
Visualisation
Cardiovascular disease
 In Southampton, in 2020/21, emergency hospital admissions for CVD were 1,416 directly age standardised rate (DSR) per 100,000 population. Emergency hospital admissions for cardiovascular disease has the highest rates for Bevois and then two wards in the west of the city: Coxford and Redbridge. More information on CVD distribution by ward is available in the Chronic conditions projections page.
When looking at England deprivation quintiles there were more admissions in areas of high deprivation than in those with lower deprivation areas. With a rate of 1,690 DSR rate per 100,000 in the 20% most deprived areas and a rate of 953 DSR per 100,000 population in the 20% least deprived, a difference of nearly 1.8 times higher in the most deprived areas.
CVD mortality
Looking at Southampton’s under 75 years old mortality rate from CVD for 2021 the rate was 84.2 DSR per 100,000, the 6th highest compared to our ONS comparators and higher but not significantly worse, than England (76.0 DSR per 100,000).
Currently trend data is unavailable due to the Office for National Statistics (ONS) have released 2021 mid-year population estimates, based on the results of the 2021 Census. These figures are not comparable with estimates for previous years. Rebased estimates for 2012 to 2020 will be published when the data is available.
In the same period (2021), males had a mortality rate of 115.3 DSR per 100,000 and the rate for females was 53.1 DSR rate per 100,000. Significantly higher than the England average of 107.7 for males and 46.1 for females. Southampton has the 5th lowest mortality rate for males and 5th highest for females compared to our ONS Comparators.
Looking at Southampton’s wards for CVD mortality, in the period 2019-21 (pooled), the ward with the lowest mortality rate, is Bassett, a rate of 46.8 DSR rate per 100,000 population under 75 years old. Lower when compared to Southampton (87.3 per 100,000). The highest is Bevois with 151.8 DSR rare per 100,000. The data on wards is based on the pre-2023 ward boundaries and will be updated once the data is available to the new ward boundaries.
Southampton’s Primary Care Networks (PCN), which are another way of looking at sub-city areas. The PCNs are based on the registered GP populations which include those people who are registered with a Southampton GP, this population is higher than the residential population as it includes people who may not live in Southampton. The lowest rate, of CVD mortality for persons aged under 75 in 2019 to 2021, was the Living Well Partnership PCN, 52.2 DSR per 100,000, compared to 68.2 DSR per 100,000 for the Southampton average. The Central PCN is the highest at 85.6 DSR per 100,000.
The differences by sex shows that Central PCN is the highest for both males and females when compared with Southampton. Males in Central PCN has a rate of 106.3 DSR per 100,000 male population significantly higher than Southampton (87.7 DSR per 100,000). Amongst the female registered population Central PCN has a rate of 59.9 DSR per 100,000 female population which is significantly higher than the Southampton average of 47.9 DSR per 100,000 female population.
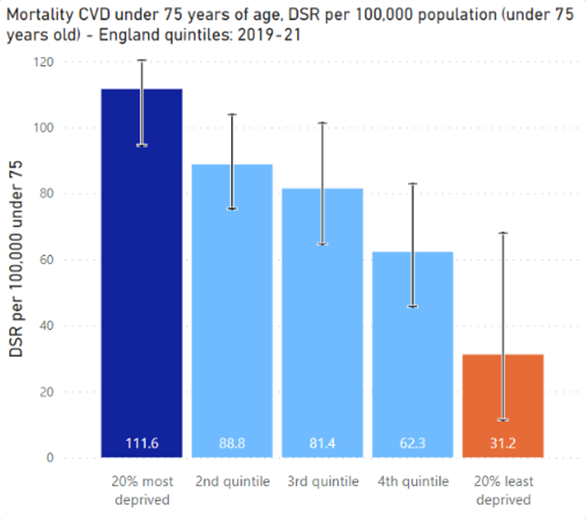
Looking at deprivation using England quintiles, there is a higher rate of mortality in areas of higher deprivation than in those with lower deprivation. With a rate of 111.6 DSR rate per 100,000 in the 20% most deprived areas and a rate of 31.2 DSR per 100,000 population in the 20% least deprived a difference 3.6 times higher in deprived areas.
More information on CVD is available in the dashboard available below and in the resources section at the bottom of the page.
Cardiovascular disease dashboard
Visualisation
Coronary heart disease (CHD)
Coronary heart disease (CHD) is a major cause of death in the UK. CHD is sometimes called ischaemic heart disease or coronary artery disease. Coronary heart disease is caused when the heart’s blood supply is blocked or interrupted by a build-up of fatty substances in the coronary arteries (NHS website (CHD)).
In 2021/22, the prevalence of coronary heart disease, in Southampton, was 2.2%, lower when compared to 3.1% in England and also ranking Southampton lowest amongst our ONS comparators. Prevalence trends for CHD both nationally and locally are falling.
Coronary heart disease (CHD) hospital admissions
In Southampton, between 2016/17 and 2020/21 emergency hospital admissions for coronary heart disease, the indirectly standardised admission ratio was 104.2 persons. With England set at 100 making Southampton significantly worse than England. It should be noted that Office for Health Improvement and Disparities (OHID) have flagged this data on Fingertips, with concerns over its quality.
Coronary heart disease emergency hospital admissions are 3.9x in the most deprived 20% of the city compared to the 20% least deprived. The highest rates by ward are for people living in Redbridge (west Southampton), followed by Bitterne (now called Thornhill) and Bevois, all areas with high deprivation. There is a higher prevalence of ischemic heart disease is within the East side of the city. For further information on CHD distribution is available on the Chronic conditions projections page and in the presentation on chronic conditions in the resources section below.
Coronary heart disease (CHD) mortality
The mortality rate from CHD for Southampton’s under 75 year olds, for 2021, was 44.9 DSR per 100,000, the 6th highest among our ONS comparators and significantly similar to the England average of 40.7 DSR per 100,000.
Currently trend data is unavailable due to the Office for National Statistics (ONS) have released 2021 mid-year population estimates, based on the results of the 2021 Census. These figures are not comparable with estimates for previous years. Rebased estimates for 2012 to 2020 will be published when the data is available.
In the same period (2021), males had a mortality rate of 61.3 DSR per 100,000 and the rate for females was 28.8 DSR rate per 100,000. Higher than the England average of 19.0 for females and lower than the England average of 63.8 for males. Southampton has the 3rd lowest mortality rate for males and 2nd highest for females compared to our ONS Comparators.
The range for the city at ward level was Bevois with a rate of 89.6 per 100,000 population under 75 years and Harefield with a rate of 19.8 per 100,000 population.
Looking at the PCN areas, based on GP registered population, for CHD mortality (2019-21 pooled) shows that among people aged under 75 years, Central PCN has the highest rate of 43.8 DSR per 100,000 population aged under 75, significantly higher when compared with the Southampton average rate of 34.8 DSR per 100,000 population aged under 75. The Living Well Partnership PCN has the lowest rate of 21.5 DSR per 100,000 population aged under 75.
More information on coronary heart disease is available in the cardiovascular disease dashboard available below and in the resources section at the bottom of the page.
Cardiovascular disease dashboard
Visualisation
Stroke
Stroke is a sub category of CVD and a stroke is a serious, medical condition that happens when the blood supply to part of the brain is cut off.
According to the NHS website (stroke), if the supply of blood is restricted or stopped, brain cells begin to die. This can lead to brain injury, disability and possibly death. There are 2 main causes of strokes:
- ischaemic – where the blood supply is stopped because of a blood clot, accounting for 85% of all cases
- haemorrhagic – where a weakened blood vessel supplying the brain bursts
There is also a related condition called a transient ischaemic attack (TIA), where the blood supply to the brain is temporarily interrupted. This causes what is known as a mini-stroke.
Certain conditions increase the risk of having a stroke, including:
- high blood pressure (hypertension)
- high cholesterol
- irregular heartbeats (atrial fibrillation)
- diabetes
Stroke prevalence in Southampton has been significantly lower than the England and more likely for those in the least deprived than the most deprived, perhaps occurring in affluent residents more likely to live longer when stroke risk is greater.
In 2021/22, the prevalence of stroke for Southampton registered patients, is 1.5% lower when compared to 1.8% in England and ranking Southampton 3rd lowest amongst ONS comparators, with Coventry (1.4%) being the lowest and Bournemouth, Christchurch and Poole (2.4%) the highest. The general trend for stroke prevalence in Southampton has been increasing overall, plateauing in recent years, but in England the prevalence is falling.
Stroke hospital admissions
 Between 2016/17 and 2020/21, in Southampton, emergency hospital admissions for stroke, was 126.4 indirectly age-standardised ratio. Compared with 100.0 for England making Southampton significantly worse. It should be noted that OHID have flagged this data on Fingertips, with concerns over its quality.
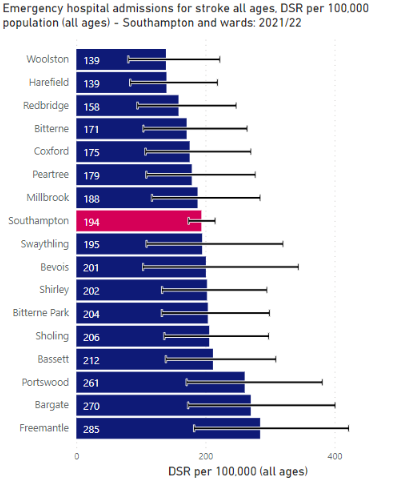
Local analysis used the same data for Southampton and sub-city wards calculating DSR showing that, in 2020/21, Southampton’s rate was 194 DSR per 100,000 population. The ward with the lowest emergency hospital admissions for stroke was Woolston (139 DSR per 100,000 population) The highest ward was Freemantle (285 DSR per 100,000 population).
Looking at England deprivation quintiles, for Southampton, there were similar numbers of admissions in areas of high and low deprivation. With a rate of 206.7 DSR rate per 100,000 in the 20% most deprived areas and a rate of 204.8 DSR per 100,000 population in the 20% least deprived, showing the most and least deprived areas to be statistically similar.
Stroke mortality
The mortality rate from stroke for Southampton’s under 75 year olds persons, for 2021, was 11.9 DSR per 100,000, the 3rd lowest among our ONS comparators, lower but similar to England (12.7 DSR per 100,000).
Currently trend data is unavailable due to the Office for National Statistics (ONS) have released 2021 mid-year population estimates, based on the results of the 2021 Census. These figures are not comparable with estimates for previous years. Rebased estimates for 2012 to 2020 will be published by ONS when the data is available.
Males have a similar mortality to that of persons, a rate of 17.7 DSR per 100,000, in the same period, higher but similar to the England rate of 15.0 DSR per 100,000. Males are ranked the 5th highest among our ONS comparators. Data for females is not currently available.
More information on stroke is available in the cardiovascular disease dashboard available below and in the resources section at the bottom of the page.
Resources
Cardiovascular disease dashboard
Analysis includes benchmarking against statistical neighbours and trends over time for Cardiovascular Disease. Some indicators include analysis at a sub-city level.
CVD dashboard
Visualisation
Current and predicted chronic conditions and predicted need for help
Below is a presentation including a mapping exercise looking at the prevalence of different chronic conditions by neighbourhood, showing the current variations of conditions across the city and an overview of the analysis.
Current and predicted chronic conditions and predicted need for help - October 2022
Hampshire County Council (HCC) - Major conditions report
The major conditions report from Hampshire County Council includes information about prevalence, emergency admissions and deaths in seven major conditions: cancer, cardiovascular disease, respiratory disease, dementia, mental health, musculoskeletal conditions and chronic kidney disease.
HCC - Major conditions report
Visualisation
OHID Fingertips - Cardiovascular disease profile
This tool presents an overview of data on cardiovascular and cardiovascular related conditions of heart disease, stroke, diabetes and kidney disease. The profiles are for commissioners and health professionals when assessing the impact of cardiovascular disease on their local population and making decisions about services. They include data on mortality, hospital admissions, procedures and disease management.
OHID Fingertips - Cardiovascular disease profile
Dataset
NHS England - Core20PLUS5
Core20PLUS5 is a national NHS England approach to inform action to reduce healthcare inequalities at both national and system level. The approach defines a target population – the ‘Core20PLUS’ – and identifies ‘5’ focus clinical areas requiring accelerated improvement. One of these five areas is hypertension.
NHS England - Core2PLUS5
Website
Other resources
CVD Prevent - Data and improvement tool
Report
NHS RightCare Toolkit - Physical ill-health and CVD prevention in people with severe mental illness
Dataset
Stroke Association
Website
NHS - Stroke
Website
NHS - Coronary heart disease
Website
ONS - Risk factors for undiagnosed high blood pressure in England: 2015 to 2019
Report
Alzheimer's Society - Vascular dementia
Website
British Heart Foundation - How your ethnic background affects your risk of heart and circulatory diseases
Website
Last updated: 28 November 2023