Supporting adults
 Population needs
Adult social care covers a wide range of activities that help people who are older or living with disability or physical or mental illness to live independently and stay well and safe. It can include ‘personal care’, such as support for washing, dressing and getting out of bed in the morning, as well as wider support to help people stay active and engaged in their communities. Social care includes support in people’s own homes (home care or domiciliary care); support in day centres; care provided by residential homes and nursing homes (care homes); reablement services to help people regain independence; the provision of aids and adaptations for people’s homes; information and advice; and support for family carers.
Population
Understanding the size and structure of Southampton’s population and how it is changing is vital in estimating population need and for the planning and commissioning of services across the city, including Adult Social Care.
The resident population of Southampton is estimated to be 264,957 in 2023, of which 135,236 (51.0%) were male and 129,721 (49.0%) were female. The 65+ population who may be more likely to need Adult Social Care is estimated as Southampton had an estimated 38,472 (14.5% of the whole population) in 2023, of which 17,716 (46.0%) were male and 20,756 (54.0%) were female.
In Southampton, there are 2,548 long-term services users engaged with Adult Social Care as of February 2025.
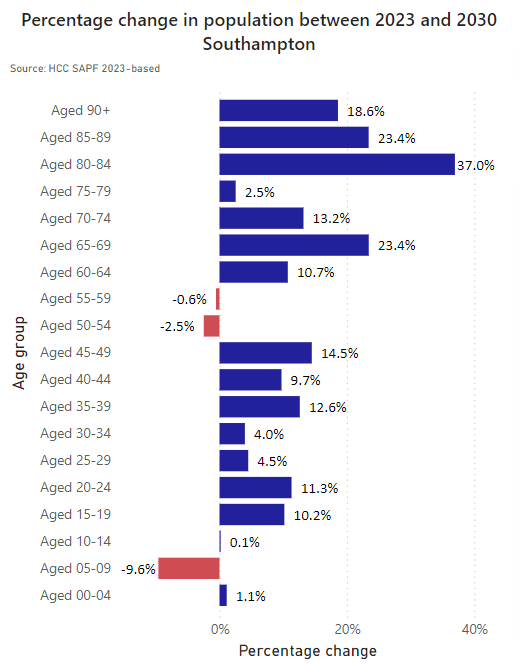 Population forecasts, from Hampshire County Council, show that between 2023 and 2030 our population is forecasted to increase by 7.5% overall an increase of 19,967 people. The population aged 65+ is predicted to increase by 18.2% (7,021 people) over the same period. There is an even greater for the 80+ age group, which is forecast to increase by +28.9% by 2030.
Looking at longer term forecasts between 2023 and 2043 the population is predicted to rise by 5.1% with the 65+ population increasing by 27.1% and the 85+ population predicted to increase by 56.5% by 2043.
The older population is projected to grow proportionately more than any other group in Southampton in the next few years. The proportion of the population of working age is steadily declining potentially impacting productivity and the skill pool of the resident workforce. Combined with the decline locally and nationally in birth rates, there is an expected impact in the informal and community care available for the ageing population in the future. This will provide a future challenge and likely increase demand for health and social care services.
More information on population and population change is available in the slide set below and on the population section.
Deprivation
 In Southampton, around 12% of Southampton’s population live in neighbourhoods within the 10% most deprived nationally and in the 2019 Index of Multiple Deprivation (IMD2019) Southampton is ranked 55th (previously 54th) most deprived of 317 local authorities (where 1 is the most deprived). Looking at older people, 4,227 (11.0%) people aged 65+, live in the 10% most deprived areas and 9,879 (25.7%) people aged 65+ live in the most deprived 20% areas.
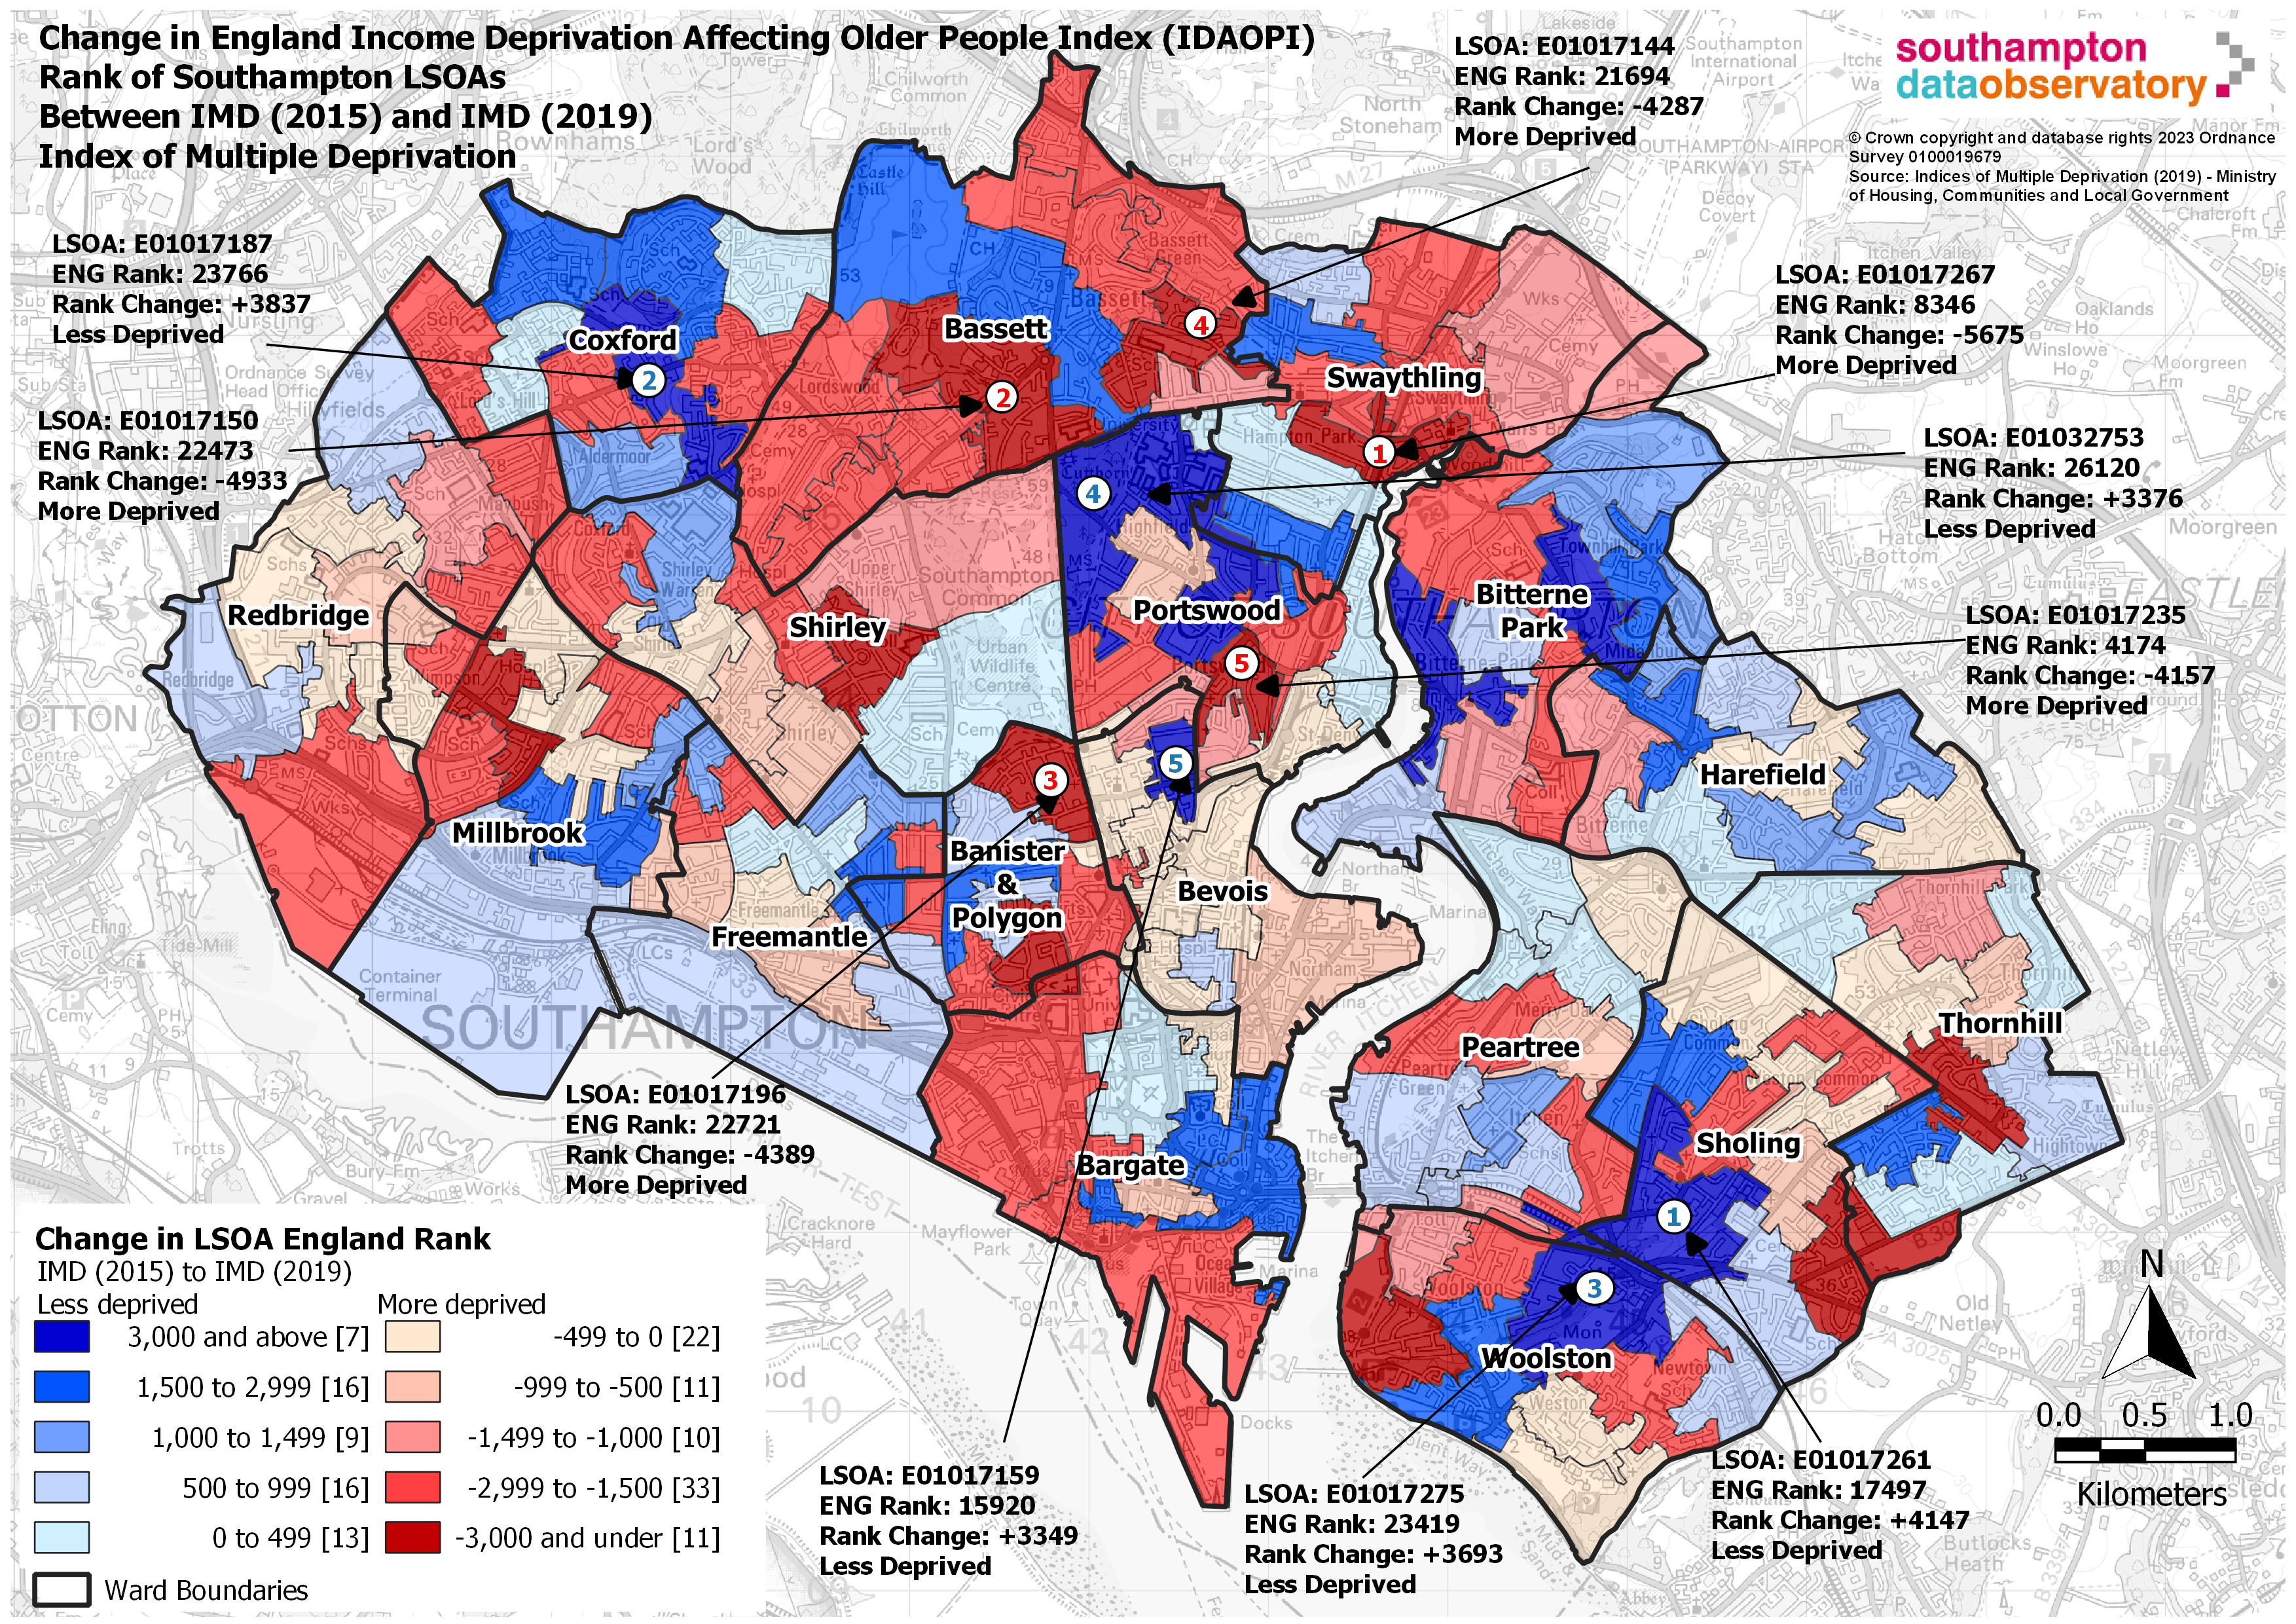
The IMD2019 includes an index on income deprivation affecting older people (IDAOPI). Southampton is ranked 56th (previously 60th) most deprived of 317 local authorities for IDAOPI (where 1 is the most deprived). 7.8% (4,227) of Southampton’s population aged 65 and over live in neighbourhoods within the 10% most income deprived for older people. Southampton has 13 LSOA within the 10% most deprived areas in England and 4 LSOA in the 10% least deprived areas for IDAOP.
More information on deprivation is available in the slide set below and on the deprivation page.
Ethnicity and language
Southampton is a diverse community, in the 2021 Census 31.9% (79,439) of the population considered themselves to be other than white British, compared with 22.3% in 2011.
In Southampton there are 10.6% (3,617) people aged 65+ who are non-white British compared with 10.3% in England. The top 5 local neighbourhood areas (LSOA) are all within Bevois ward ranging from 87.7% of the population aged over 65 who are non-white British to 47.9%. The neighbourhood area with the lowest percentage is in Woolston ward with just 2.0% of residents aged over 65 with a non-white British ethnicity.
Across Southampton around 160 languages spoken in the city. The 2021 Census looked at people’s ability to speak English, known as proficiency in English. In Southampton, 203,603 (84.6%) of residents have English as their main language and 37,044 (15.4%) of residents do not have English as their main language.
Languages spoken in Southampton, Census 2021 and difference between 2011 and 2021.Of these 37,044 people, 83.4% speak English well or very well. 14.6% (5,398 people) cannot speak English well and 2.1% (761 people) cannot speak English at all. In England 17.1% cannot speak English well and 3.1% cannot speak English at all.
Any language barrier between clients and the Adult Social Care teams, may cause issues and patients with limited English language or literacy can find it difficult to engage with Adult Social Care services. For more information on ethnicity and language the Ethnicity, language and identity page.
Other groups that may be need adult social care services include veterans, people with disabilities, people with dementia and people who are socially isolated.
More information on these groups is explored in the next section and in the slide set below.
Older people and Adult Social Care users slide set: May 2025
Who is more likely to need adult social care
Older people are generally more likely to need adult social care than younger adults. However, working-age adults with disabilities, mental health problems, or complex needs also require support. Demand for social care is increasing across all age groups, with specific pressures related to an aging population and a growing number of people living with disabilities. (House of Commons Library – Adult social care funding in England). Some of the groups of people who may need adult social care are listed below, these groups do not cover everyone who may need to access the service.
Carers
Adult social care provides support for individuals with disabilities, physical or mental health conditions, or those needing help with daily living, to live independently and stay safe. Carers, who are individuals regularly providing care to someone due to their illness, disability, or age, can also access support and information through adult social care services (NHS England – Carers).
In Southampton 7.7% (18,138) of residents provide some type of unpaid care. 1 in 8 (12.6%) of residents aged over 50 provide some level of unpaid care, around 9,300 people. This breaks down to 31.4% (5,699) people aged 50 to 64 and 19.8% (3,582) of people aged 65+. Of these 3,582 people aged 65+, 46.8% provide more than 50 hours of care a week (1,675 residents). Older aged groups provide more unpaid care and as the carers themselves they are also more likely to have poorer health. Southampton’s most deprived quintile has the highest percent of unpaid carers (1 in 11 residents; 9.0%) and significantly higher when compared to the least deprived quintile (1 in 16; 6.4%). Over 70% of care provided by people giving 20+ hours comes from people living in the two most deprived quintiles.
At aged 65 and over, female unpaid carers (57.3%) are more likely to be in good health than males (53.1%). Male unpaid carers between the aged of 16 and 64 (76.6%) are more likely to be in good health compared to females (73.5%).
For more information on carers in Southampton see the slide set below and the Carers page.
Dementia
Dementia is a general term for a loss of memory, language, problem-solving or other thinking ability that is severe enough to interfere with daily life. There are different diseases that can be categorised as dementia with a variety of causes. Dementia is progressive, symptoms may be mild to begin with but get worse over time, having a substantial impact on a person’s life and the people around them.
Most people diagnosed with dementia continue living at home, particularly in the early stages. There are ways to make a home more dementia friendly, however almost all people with dementia will eventually need help from other people with day-to-day tasks. This may be from professional carers, friends or family. It is estimated that 70% of people with dementia may eventually need long-term residential care.
Southampton’s crude prevalence of dementia for was 0.6% or 1,854 in 2023/24. For more information on dementia see the Dementia page.
Disabilities and frailty
In the 2021 Census people were asked about whether or not they considered themselves disabled. In Southampton 17.7% (43,937) of residents identify as having a disability under the Equality Act.
Looking at disability in more detail it is estimated that 6,728 people aged 65+ have a mobility issue (people being unable to manage at least one mobility activity on their own) in Southampton and this is predicted to rise by 28.3% to 8,631 people by 2040. Activities include going out of doors and walking down the road; getting up and down stairs; getting around the house on the level; getting to the toilet; getting in and out of bed. This may indicate more people needing Adult Social Care in the future (Projecting Older People Population Information (POPPI)).
37,100 Southampton residents aged 65+ are GP registered. They are categorised using the medical model eFI (electronic frailty index) into frailty categories of:
- Fit (41%)
- Mild (32%)
- Moderate (20%)
- Severe (7%)
Just over 1 in 4 (27%) of aged 65+ are categorised as moderate or severe frailty (10,100 people), 1 in 14 (7%) have severe frailty (2,600 people). By age band, 6 out of 10 (59%) 85 to 89 year olds and 7 out of 10 (71%) 90+ year olds have moderate or severe frailty. As our residents age, the percentage being frail and the frailty severity increases. More information is available in the slide set below.
Learning Disabilities
People with a learning disability may need high levels of social care. The level of support needed depends on the individual. For example, someone with a mild learning disability may only need support with things like getting a job. However, someone with a severe or profound learning disability may need full time care and support with every aspect of their life – they may also have physical disabilities. People with certain specific conditions can have a learning disability too. For example, some people with autism or with Down’s syndrome may have a learning disability.
Approximately 5 in 200 people have a learning disability, but only 1 in those 200 people who have a learning disability, have it recorded by the GP.
In Southampton, 4,988 people (aged 18 and over) are estimated to have a learning disability in 2025, forecast to increase by 5.8% to approximately 5,278 people by 2040 (Projecting Adult Needs and Service Information (PANSI)). In Southampton 0.5% (1,648) of registered patients are diagnosed with a learning disability in 2023/24. The diagnosed prevalence by ward shows the range across the city (730.1 per 100,000 population for Coxford nearly 2.2 times compared to 332.6 per 100,000 population in Banister and Polygon.
For more information on people with a learning disability see the learning disabilities page and the slide set below.
Mental health
Mental health conditions, refer to a wide range of mental health diagnosis, these conditions can alter mood, thinking and behaviour. The most frequently occurring include common mental disorders, depression, severe mental illnesses, including Schizophrenia and bipolar disorder and self-reported wellbeing. For more information including common mental disorders (CMD), depression and severe mental illnesses see the Mental health page.
Social isolation
Loneliness and social isolation can reduce quality of life, damage physical and mental health and shorten lives (WHO).
Datasets for different life stages were drawn together at lower super output area level to assess differences between neighbourhoods in the city.
The indicators for older people used to calculate this life stage were:
- No cars/vans in household
- English is not the main language
- Long term health problem or disability
- Provides unpaid care
- Single person household, separated or widowed
- Age-related macular degeneration or glaucoma
- Depression or bi-polar disorder Population aged 65 and over
- Income Deprivation Affecting Older People Index (IDAOPI)
For more information on the results of the social isolation index see the Social isolation page and see the map below.
Older People
Veterans
Veterans are more likely to be older people or be living with a disability or both, than the rest of the population.
The Census 2021 recorded 6,361 (3.1%) Southampton residents (aged 16 and over) who had previously served UK armed forces or reserves (veterans). The 2021 Census records of the 6,361 Southampton residents who are veterans; nearly 9 out of 10 were male (86.8% of people who previously served in the UK armed forces or in the reserves were male and 13.2% were females.
Veterans are more likely to be older people; 51.7% of veterans locally and 53.2% of veterans in England are aged 65 and over.
In Southampton, 35.9% of veterans, reported themselves to be in bad health higher when compared to 35.5% of veterans in England, but also far higher than 20.1% of the overall city population (aged 16 and over) reporting to be in bad health. This may be due to combat sustained injuries. Variation among Southampton wards ranges from 43.3% of veterans in both Coxford and Bitterne are not in good health to Bargate (30.7%).
Three out of ten veterans (31.4%) are disabled under the Equality Act and of those 48.4% of people who served had their day-to-day activities limited a lot and 51.6% reported having their day-to-day activities limited a little. This compares to two out of ten (19.8%) for Southampton’s general population who are disabled under the Equality Act - with 39.8% of all Southampton residents aged 16 and over had their day-to-day activities limited a lot and 60.2% limited a little.
For more information on veterans see the Veterans page or the slide set below.
Older people and Adult Social Care users slide set: May 2025
Who is using adult social care
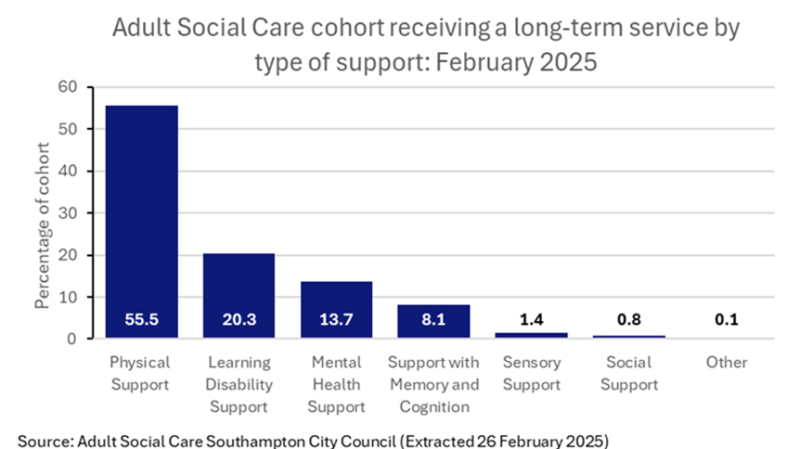 There are currently 2,548 long-term service users in Southampton, they are categorised by primary support reason; of which over half (55.5%; 1,415) are receiving physical care support, 20.3% (517) are receiving learning disability support and 13.7% (350) are receiving Mental Health Support. Over half, 53.6% are female and nearly 1 in 3 (33.1%) of all service users are aged 80+ and 1 in 2 (50.9%) are aged 70+.
309 long-term service users (12.1% or 1 in 8) are supported outside the city. 100 of these out of city service users have a learning disability as their primary support reason.
1 in 3 (32.5%) long-term service users who live in the city, live in the most deprived 20% neighbourhoods in England, higher than for the city population, where 27.6% of residents live in neighbourhoods classed as in the most deprived 20% in England.
For those who gave their ethnicity, 1 in 6 (16.8%) service users are non-white British, compared to 1 in 3 (31.9%) of the city’s residents. The largest service user groups by ethnicity are white British (83.9%), all other white groups (5.2%) and Asian (4.6%), the percentages of these groups in the city are white British (68.1%), other white groups (12.6%) and Asian (10.6%) respectively.
Physical support
 Over half (55.5%; 1,415) of the long-term service users (2,548) are receiving physical care support. Of these; it can be split by 92.8% (1,313) receiving personal care support and 7.2% receiving access and mobility support only.
86 people with primary support reason of physical support are supported outside the city. This is 6.1% of service users with physical support primary reason, lower compared to 12.1% of all long-term service users supported outside the city.
1 in 7 (14.9%) receivers of physical support are non-white British, lower when comparing with 1 in 6 (16.8%) of all Adult Social Care long-term service users are non-white British, and 1 in 3 (31.9%) of the city’s residents.
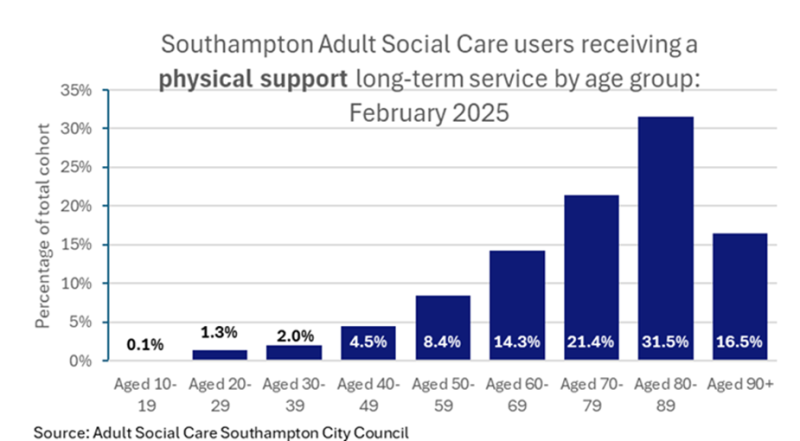
Females make up 61.1% long-term service users receiving physical support, higher than across all long-term service users, where 53.6% are female. For female physical support service users, 6 out of 10 (63.1%) users age 65+ and 7 out of 10 (69.7%) users age 80+. Compares higher with the city where 49.0% (all ages), 54.0% (65+) and 58.6% (80+) are female.
By age group, nearly half (48.0%) of physical support users are 80+, 7 in 10 (69.4%) are 70+ and 3 out of 4 (76.6%) are aged 65+.
The largest service user groups by ethnicity stated are white British (85.6%), white other (4.3%) and Asian (3.6%); the percentages of these groups in the city age 65+ is 89.4% white British ,4.4% white other and 3.8% Asian.
Over 1 in 3 (36.0%) physical support long-term service users who live in the city, live in the most deprived 20% neighbourhoods in England, higher than for the city population, where 27.6% of residents and 25.7% of 65+ residents live in neighbourhoods most deprived 20%.
Learning disability
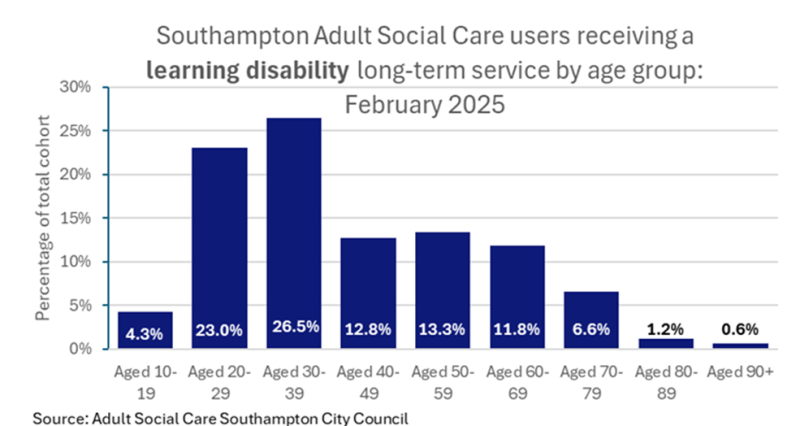 1 in 5 (20.3%; 517) of the long-term service users (2,548) are receiving learning disability support as their primary support reason. Of these 100 people (19.3%) are supported outside the city, higher compared to 12.1% of all long-term service users support outside the city.
Males make up 63.4% long term service users receiving learning disability support, far higher than across all long-term service users, where 46.4% are male. However, this is in keeping with clinical diagnoses of learning disability in Southampton where 60.8% are male.
Looking at the 517 learning disability service users by age group; 49.5% (256 service users) are aged 20 to 39 years,) and of the 265 service users aged 20 to 39; 66.8% are males. (40.8% of clinical diagnoses with a learning disability are aged 20 to 39 years).
Self-reported ethnicity shows that 1 in 7 (14.9%) learning disability service users are non-white British lower when comparing with 1 in 6 (16.8%) of all Adult Social Care long-term service users are non-white British, and 1 in 3 (31.9%) of the city’s residents.
The largest service user groups by ethnicity stated are white British (85.1%), Asian (4.5%) and white Other (12.6%); the percentages of these groups in the city are 68.1%, 10.6% and 3.8% respectively.
Just under 3 in 10 (28.5%) learning disability long-term service users who live in the city, live in the most deprived 20% neighbourhoods in England, similar to than for the city population, where 27.6% of residents live.
Mental health support
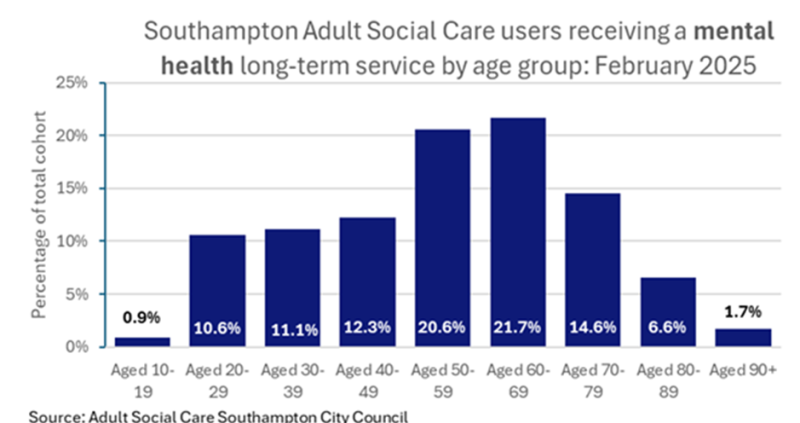 1 in 7 (13.7%; 350) of the long-term service users (2,548) are receiving mental health support as their primary support reason. Of these 350, nearly a quarter or 23.7% (83 people) are supported outside the city, higher compared to 12.1% of all long-term service users support outside the city.
Males make up 51.6% long-term service users receiving mental health support, higher than across all long-term service users, where 46.4% are male.
Looking at the 350 service users age groups; 42.3% (256 service users) are aged 50 to 69 years, and of the 265 service users aged 20 to 39; 66.8% are males.
Self-reported ethnicity shows that 1 in 4 (22.8%) mental health service users are non-white British higher when comparing with 1 in 6 (16.8%) of all Adult Social Carer long-term service users are non-white British, and lower than 1 in 3 (31.9%) of the city’s residents.
The largest service user groups by ethnicity stated are white British (77.2%), Asian (6.9%) and white Other (4.9%); the percentages of these groups in the city are 68.1%, 10.6% and 3.8% respectively.
3 in 10 (30.7%) mental health long-term service users who live in the city, live in the most deprived 20% neighbourhoods in England, higher than for the city population, where 27.6% of residents live in the most deprived 20%.
More information on long-term users of adult social care is available in the slide set below and in the resources section.
Older people and Adult Social Care users slide set: May 2025
How does Southampton perform in adult social care
Adult social care performance focuses on how well services and providers meet the needs of individuals, including their ability to navigate the system, receive appropriate support, and achieve desired outcomes. This is measured through various performance indicators, including those within the Adult Social Care Outcomes Framework (ASCOF). Southampton City Council, for example, outlines its goals for quality, early intervention, workforce development, and service accessibility within its Adult Social Care Strategy 2024-2029. Adult social care performance is tracked through various methods, including:
The Adult Social Care Outcomes Framework (ASCOF) measures combine adult social care data returns to be used locally, regionally and nationally to measure progress against key priorities and strengthen transparency and accountability. Importantly, it measures how well care and support services achieve the outcomes that matter most to people.
The ASCOF sets priorities for the sector focused on how well services help adults with care needs and unpaid carers achieve outcomes across 6 key areas:
- Quality of life: people’s quality of life is maximised by the support and services which they access, meaning how good they perceive their life to be across multiple aspects, while ensuring that public resources are allocated efficiently.
- Independence: people are enabled by adult social care to maintain their independence and, where appropriate, regain it.
- Empowerment - information and advice: individuals, their families and unpaid carers are empowered by access to good quality information and advice to have choice and control over the care they access.
- Safety: people have access to care and support that is safe, and which is appropriate to their needs.
- Social connections: people are enabled by adult social care to maintain and, where appropriate, regain their connections to their own home, family and community.
- Continuity and quality of care: people receive quality care, underpinned by a sustainable and high-quality care market and an adequate supply of appropriately qualified and trained staff.
Details about the separate data returns are available below and are published on the Adult Social Care data hub.
The Adult Social Care User Survey (ASCS)
The Adult Social Care Survey (ASCS) is an annual postal survey conducted by local authorities on behalf of NHS England. It asks people who receive adult social care about their experiences, quality of life, and the impact of care and support services. The survey results are used to provide a national overview of adult social care, support accountability, and identify areas for improvement.
Results for Southampton show:
- Southampton improved across all seven metrics between 2022/23 and 2023/24. Four metrics Southampton performed better than the England average and three where Southampton performed below the England average.
- For these seven metrics, Southampton’s ranked position among all 152 local authorities improved between 2022/23 and 2023/24. The greatest improved were for Overall satisfaction of people who use services with their care and support, Proportion of people who use services who feel safe and Proportion of people who use services who reported that they had as much social contact as they would like, which all improved more than 50 ranked positions among the 152 local authorities.
- Proportion of people who use services who report having control over their daily life is the metric that hold its highest position among local authorities being placed 45th for 2023/24 (also an improvement on 2022/23 where it was ranked 81st.
The survey of Adult Carers in England (SACE)
The Survey of Adult Carers in England (SACE) is a national survey takes place every other year and is conducted by Councils with Adult Social Services Responsibilities (CASSRs). The survey seeks the opinions of unpaid adult carers aged 18 or over. It focuses on the impact of their caring role on their overall well-being and quality of life, including aspects like social contact, satisfaction with social services, and ease of finding information. The survey's purpose is to provide data for local and national decision-making related to adult social care support, contributing to the Adult Social Care Outcome Framework.
- The SACE (Survey for Adult Carers in England) showed Southampton improved across one metric between 2021/22 and 2023/24 (Overall satisfaction of carers with social services) however the ranking only improved from 115th to 103rd out of 152 local authorities. The remaining four metrics showed deterioration for Southampton, additionally for three of these metrics the England average improved, further widening the gap between Southampton and the England average. The greatest ranking decrease was for Proportion of carers who find it easy to find information about services decreasing from 26th best in 2021/22 to 118th best in 2023/24.
Adult Social Care Short and Long-Term Support (SALT)
The Adult Social Care Short and Long-Term Support (SALT). Data taken from the Adult Social Care Finance Return (ASC-FR) and Short and Long Term (SALT) collection to provide information regarding adult social care activity and finance on Councils with Adult Social Care (CASC)
- The SALT (Short and Long Term) return for 2023/24 showed improved for Southampton for three measures, three measures stayed at similar levels and four measures decreased. The biggest ranking changed was Long-term support needs of older adults (aged 65 and over) met by admission to residential and nursing care homes, per 100,000 population deteriorating from ranking 108th to 136th out of the 152 local authorities
- The proportion of people using social care who receive direct payments is the worst ranked SALT metric, placing Southampton 139th best out of 152 local authorities
- Southampton’s best ranked measure for people who use services is “Proportion of older people (aged 65 and over) offered reablement services following discharge from hospital” when in 2023/24 we ranked 29th among the 152 local authorities, we were previously ranked 22nd in 2022/23 and Southampton City Council consistently remained higher than England.
- Another reablement measure “Proportion of older people (aged 65 and over) who were still at home 91 days after discharge from hospital into reablement / rehabilitation services” saw the biggest positive change in ranking for SALT metrics from 129th to 113th for 2023/24
- For “Long-term support needs of younger adults (aged 18-64) met by admission to residential and nursing care homes, per 100,000 population”, the Southampton rate has been increasing over time but remaining under the England average, until the most recent year 2023/24 where the rate exceeds that of England.
More information is available in the slide set in the resources section below.
Resources
Service users of Adult Social Care slide set
This slide pack summarises information on the Southampton Data Observatory which embeds the local JSNA (Joint Strategic Needs Assessment) describing the needs of Southampton older people (65+ years), people who happen to have a learning disability, carers and adult social care users.
Older people and Adult Social Care users slide set: May 2025
Adult Social Care Strategy 2024 - 2029
This strategy for Adult Social Care at Southampton City Council sets out what we want to achieve by working as a team with partners, residents and communities across the city over the next 5 years.
Southampton City Council - Adult Social Care Strategy 2024 - 2029
Report
Adult Social Care information
Information on how Adult Social Care is reported.
NHS Digital - Adult Social Care Activity and Finance Report
Report
NHS Digital - Adult Social Care Outcomes Framework (ASCOF)
Report
NHS Digital - Adult Social Care Survey (ASCS)
Report
NHS Digital - Adult Social Care Survey (ASCS)
Report
NHS Digital - Survey of Adult Carers in England (SACE)
Report
NHS Digital - Adult Social Care Financial Returns and Short and Long-Term Support (ASC-FR - SALT)
Report
NHS Digital - Adult Social Care data hub
This hub allows you to explore a range of adult social care datasets and interactive tools.
Adult social care data hub
Website
The King’s Fund - Key facts and figures about adult social care
What is social care? How many people deliver social care? How much does social care cost individuals and the state? information on the key facts and figures around adult social care.
• The King’s Fund - Key facts and figures about adult social care
Website
House of Commons Library - Adult social care funding in England
An overview of the funding local authorities receive to provide adult social care services in England
House of Commons Library - Adult social care funding in England
Website
Last updated: 06 May 2025