Social isolation
 Loneliness and social isolation
Loneliness and social isolation can reduce quality of life, damage physical and mental health and shorten lives (WHO).
While the terms ‘loneliness’ and ‘isolation’ are sometimes used as if they were synonymous, they refer to two different concepts. Loneliness refers to the subjective feeling of not having the social contact, either the quantity or quality of social contact, that one desires. In contrast, isolation is an objective measure of separation from social or familial contact, community involvement, or access to services.
It is possible to be isolated without being lonely, and to be lonely without being isolated. For instance, an older person can be physically isolated (living on their own, not seeing many other people etc.) without feeling lonely. For some, physical separation is even a result of choice. Similarly, you can feel lonely surrounded by lots of people. Both may occur at the same time. People move in and out of social isolation and loneliness depending on their personal circumstances.
Social connectedness is a sense of belonging to a group, family, or community. It is about the relationships people have with each other and their engagement with the broader community. Social connection is an integral component of health and well-being.
Locally within the Hampshire and Isle of Wight Integrated Care Strategy, there is a Social Connectedness programme with the ambition to improve social connectedness and decrease social isolation across Hampshire and Isle of Wight by working with communities to understand their needs and to develop and ensure the sustainability of community assets. They will aim to do this by taking a life course approach to improve social connectedness, thereby reducing social isolation and loneliness and building social capital through supporting organisations and individuals/communities across HIOW and addressing inequalities in specific communities. Also, by improving mental and physical health for all ages and increase independence in older adults, reducing the need for health and care services as well as reducing unemployment and increasing productivity.
Nationally, the Government set out three overarching objectives in the 2018 Loneliness Strategy to guide the ongoing work:
- Reduce stigma by building the national conversation on loneliness, so that people feel able to talk about loneliness and reach out for help.
- Drive a lasting shift so that relationships and loneliness are considered in policy-making and delivery by organisations across society, supporting and amplifying the impact of organisations that are connecting people.
- Play our part in improving the evidence base on loneliness, making a compelling case for action, and ensuring everyone has the information they need to make informed decisions through challenging times.
Further information on the Governments work on tackling loneliness can be found in the resources section.
Social Isolation Dashboard
Visualisation
The risk factors loneliness and social isolation
Reported loneliness is higher for those who are:
- 16-24 years old
- female
- single or widowed
- living with a limiting mental health condition
- renters
- lower neighbourhood belonging (feeling connected to their community)
- lower local social trust (confidence in the moral orientation or trustworthiness of our fellow citizens)
Research shows personal characteristics, social and structural factors and certain life events can be risk factors for loneliness. For young people, their experiences of bullying, moving schools, illness or disability, changes in family circumstances or not getting on with family, and isolation from the pandemic could all contribute to loneliness. Major milestones in life such as leaving or furthering education, employment, moving out of the parental home and long term relationships all change a person's social dynamics. The Co-Op Foundation reported in October 2022 that 55% of lonely young people they spoke to said not having the money to attend or take part in activities was already having a negative impact on how lonely they feel. This may be made worse for those with active social media accounts as 56% of young people say seeing friends having fun on social media has a negative impact.
The older we get, the risk factors that may lead to social isolation and loneliness increase. In the latest analysis report from Age UK, older people aged 50+ in England are:
- 5.2 times more likely to be often lonely if they are facing bereavement
- 1.6 times more likely to be often lonely if they are living alone
- 3.7 times more likely to be often lonely if they are living with limiting disabilities or illnesses
- 2.6 times more likely to be often lonely if they are caring for a partner
- Physical and mental health difficulties, making it harder to participate in activities and maintain relationships
- 2.3 times more likely to be often lonely if they have low fixed incomes, such as pensions, making activities unaffordable
- 3.0 times more likely to be often lonely if they don’t feel they belong to their neighbourhood e.g., Digital exclusion
- Reduced mobility and loss of access to affordable, reliable, and/or suitable modes of transport
Gender identity may have an impact on social isolation and loneliness; however evidence doesn’t suggest that one gender is lonelier than the other. LGBTQ+ people are at a greater risk of loneliness as social rejection, exclusion, and discrimination can lead LGBTQ people to feel more lonely. Older LGBTQ+ people more vulnerable to social isolation as they are more likely to be single, living alone and less contact with relatives. A person's long-term health, disability or mental health impacts the risk of loneliness and social isolation. Family circumstances can contribute to loneliness, such as: adult children leaving home, bereavement, becoming single, weak familial relationships, and being at home with young children. People from a lower socio-economic status or a socio-economically disadvantaged area are at a higher risk. This could be due to inequality in resources and limited finances.
Social Isolation Dashboard
Visualisation
The impact of loneliness and social isolation
Physical and mental health
It has been well documented that there is a close relationship between loneliness and health and in 2022 people who said they had a physical and/or mental health diagnosis were over 3 times more likely to be chronically lonely than those who did not. Being lonely or social isolated has an influence on our day-to-day activities which can include making it difficult to complete daily activities, being less active and higher chance of smoking. There can be a substantial damaging effect on an individual’s physical, mental and emotional health resulting in:
- Increased risk of higher blood pressure
- 29% increased risk of incident coronary heart disease
- 32% increased risk of a stroke
- Poor nutrition
- Decreased immunity
- Fatigue and poor sleep quality
- Progression of frailty
- Higher chronic pain
- Poorer mental health risk
- Suicide at an older age
- Increased stress
- Cognitive impairment, decline and dementia
The contribution to a person's decline in mental health can include losing confidence in socialising, overwhelmed in social situations and more time to ruminate on worries and negative thoughts.
Mortality
It is also associated with increasing the risk of early mortality by 26%; comparable to well-established risks such as smoking and alcohol consumption. Weak social connections carry a health risk that is more harmful than not exercising, twice as harmful as obesity, and is comparable to smoking 15 cigarettes a day or drinking alcohol excessively. The Marmot Review into health inequalities found that “individuals who are socially isolated are between two and five times more likely than those who have strong social ties to die prematurely.”
Health and social care services
As a result of these health impacts, lonely individuals tend to make more use of health and social care services and are more likely to have early admission to residential or nursing care. The cost of severe loneliness is estimated to be £9,900 per person per year due to its impact on multiple areas of a person’s life. Tackling loneliness is relevant to a number of important agendas for local authorities, in particular public health.
Education and the workplace
There is also an impact on the education and the workplace. In early adolescence, lower education attainment is linked to loneliness and 48% say they are “less likely to want to progress in work”. In workplaces there is and associating with poorer work performance among employees who have higher loneliness levels. The British Red Cross report found:
- One-in-ten workers often or always experience aspects of loneliness at work, while nearly half of workers feel lonely some of the time.
- Disabled workers and those with long-term health conditions affecting their day-to-day lives are more likely to report general loneliness than those without (24%, compared to 9%).
- Workers from other ethnic groups are more likely to feel that they often or always have no one to talk to at work (13%, compared to 9%) than white workers. They also feel that their colleagues are like strangers to them (37% of workers from other ethnic groups, compared to 27% of white workers.)
- Senior managers report higher levels of general loneliness – 32% of senior managers are often or always lonely, which is nearly twice the average, and are also more likely to feel that their colleagues are like strangers.
- Contact with colleagues is not enough to prevent loneliness and home workers are not lonelier than those working onsite. However, 84% of onsite workers agree they feel close to their colleagues, compared to only 44% homeworkers.
Social Isolation Dashboard
Visualisation
Social isolation and loneliness in Southampton and England
On average, 25% of adults report they feel lonely often, always or some of the time between March 2020 and November 2023 in the Opinions and lifestyle survey. In the most recent release period (15th-26th November 2023), the highest percentage answered they feel lonely hardly ever (28%). The second highest response was “occasionally” with 25% and the third highest is “some of the time” with 19%.
The Community Life Survey states in 2021/22, 6% of respondents (approximately 3 million people in England) said they feel lonely often or always. This is the same as in 2019/20 and 2020/21. There were differences by age group in feelings of loneliness, with people aged 16-24 more likely to say they feel lonely often/always (10%) than every other age group (3 to 6%) aside from those aged 25-34 (9%). People with a limiting long-term illness or disability were more likely to say they felt lonely often/always than those without (13% compared with 3%) and less likely to say they never felt lonely (16% compared with 24%). Those living in the most deprived areas were more likely to feel lonely often/always than those living in the least deprived areas (9% compared with 4%). No variability was seen between different ethnic groups, region or rural/urban categories.
In the Southampton City Survey 2020, levels of loneliness and social isolation appear to have increased in Southampton since 2018. When asked a question, residents gave a score between 0 (being “not at all”) and 10 (being “completely”). 16% of residents gave a high score (7-10) for the question “To what extent do you feel lonely or isolated in your daily life?”, an increase of 5 percentage points in 2018. Females (4.2%) were more likely to report very high levels of loneliness and social isolation (score 9-10) compared to males (1.5%). Similarly, those aged 75+ (8.3%) were more likely to report very high levels of loneliness and social isolation (score 9-10) compared to those aged 25-34 (1.3%). Fewer people reporting high levels of loneliness compared to the 3rd COVID-19 resident survey. Low levels of loneliness in the COVID-19 residents survey were reported at 54%, medium levels were 22% and high levels were reported at almost 1 in 4 (24%). These differences are likely to reflect the different survey sampling methodologies.
The percentage of adult social care users, 18+, who have as much social contact as they would like for Southampton in 2022/23 is 39.2%, lower, but not significantly, than England and the lowest amongst ONS comparators. Although this is still an increased from 2019/20 (38.1%), it is still the 2nd lowest score for Southampton since 2010/11. For ages 65+, this is 35.7% for Southampton, lower, but not significantly to England (41.5%) and no significant change from 2021/22 (35.6%).
For adult carers who are 18+, 30.3% have as much social contact as they would like in 2021/22, an increase of 8.1 percentage points from 2018/19 (22.2%) and higher, but not significantly, than England (28.0%). Southampton is the 5th highest amongst ONS comparators. For ages 65+ in 2021/22, 31.9% of adult carers have as much contact as they would like in Southampton, higher, but not significantly, than England’s value of 28.8% however the 4th lowest amongst ONS comparators.
As the number of older people in England continues to grow, the number of older people who are persistently lonely is also projected to increase. Before the pandemic, around 1 in 12 people aged fifty and over in England were often lonely, equivalent to around 1.4 million people, a number predicted to increase to around 2 million people by 2026.
Further factors of social isolation and loneliness in Southampton can be found in our Economic Needs Assessment relating to employment in the city and our mental health page.
Social Isolation Dashboard
Visualisation
Social Isolation Index for Southampton (SIIS)
Social isolation and loneliness can occur at any stage of life. However, different circumstances at different life stages are likely to lead to an individual becoming socially isolated or triggering feelings of loneliness.
As a result of these limitations and a local demand for increased intelligence on social isolation, a local Social Isolation Index for Southampton (SIIS) has been developed in an attempt to provide some further insight into areas at increased risk in the city. The SIIS considers social isolation over the different life stages in Southampton, rather than just focusing on older people. Several different methodologies were reviewed, and data used in these models assessed along with other known datasets available measuring some additional risk factors identified in the literature for each stage of the life course.
Datasets were drawn together at lower super output area level in order to assess differences between neighbourhoods in the city. These were then combined into an index for each life stage and mapped to show areas, which may have an increased risk of social isolation in the city. These maps along with further information on the methodology and data used can be found in the Southampton loneliness and social isolation briefing available to download in the resources section of this page.
It is recommended that new mothers are targeted for schemes aimed at reducing social isolation by health visitors and other people who are likely to be in contact with new mothers. Research has also shown that lesbian, gay, bisexual and transgender (LGBT) people are also at risk of loneliness and social isolation due to the stigma and isolation they deal with in their daily lives. Older people in the LGBT are at particular risk of social isolation and loneliness as they are more likely to live alone and they are less likely to have children to call upon in times of need than people who are not LGBT (Greenwood, 2015). People who are LGBT have not been included in the SIIS as information is not available at the low geographical level required for the SIIS.
Below is a list of indicators used for each life stage:
Young people aged 0 to 15 years:
- Indicator 1 - English is not the main language (2021 Census - ONS)
- Indicator 2 - Long term health problem or disability (2021 Census - ONS)
- Indicator 3 - Provides unpaid care (2021 Census -ONS)
- Indicator 4 - Year 6 excess weight (National Child Measurement Programme)
- Indicator 5 - NEET - Not in education, employment or training (Southampton City Council education team)
- Indicator 6 - Income Deprivation Affecting Children Index (IDACI) (Department for Levelling Up, Housing & Communities)
Working age population aged 16 to 64 years:
- Indicator 1 - English is not the main language (2021 Census - ONS)
- Indicator 2 - Long term health problem or disability (2021 Census - ONS)
- Indicator 3 - Provides unpaid care (2021 Census - ONS)
- Indicator 4 - No qualifications (2021 Census - ONS)
- Indicator 5 - Unemployment benefits ( Department for Work and Pensions DWP)
- Indicator 6 - Divorced, separated or widowed (2021 Census - ONS)
- Indicator 7 - Lone parents (2021 Census - ONS)
- Indicator 8 - Depression or bi-polar disorder (Sollis 2021)
- Indicator 9 - Index of Multiple Deprivation (Department for Levelling Up, Housing & Communities)
- Indicator 10 - One person households (2021 Census - ONS)
Older people aged 65 years and over:
- Indicator 1 - No cars/vans in household (aged 66 and over) (2021 Census - ONS)
- Indicator 2 - English is not the main language (2021 Census - ONS)
- Indicator 3 - Long term health problem or disability (2021 Census - ONS)
- Indicator 4 - Provides unpaid care (aged 65 and over) (2021 Census - ONS)
- Indicator 5 - Single person household (aged 66 and over) (2021 Census - ONS)
- Indicator 6 - Divorced, separated or widowed (2021 Census - ONS)
- Indicator 7 - Age-related macular degeneration or glaucoma (Sollis 2021)
- Indicator 8 - Depression or bi-polar disorder (Sollis 2021)
- Indicator 9 - Population aged 65 and over (2021 Census - ONS)
- Indicator 10 - Income Deprivation Affecting Older People Index (IDAOPI) (Department for Levelling Up, Housing & Communities)
All ages:
- Indicator 1 - No cars or vans in household (2021 Census - ONS)
- Indicator 2 - English is not the main language (2021 Census - ONS)
- Indicator 3 - Long term health problem or disability (2021 Census - ONS)
- Indicator 4 - Provides unpaid care (2021 Census - ONS)
- Indicator 5 - Single person households (2021 Census - ONS)
- Indicator 6 - Divorced, separated or widowed (2021 Census - ONS)
- Indicator 7 - Age-related macular degeneration or glaucoma (Sollis 2021)
- Indicator 8 - Depression or bi-polar disorder (Sollis 2021)
- Indicator 9 - Lone parents (2021 Census - ONS)
- Indicator 10 - Index of Multiple Deprivation (Department for Levelling Up, Housing & Communities)
Below the top 5 highest ranking Lower Level Super Output Areas (LSOA) in each domain, what ward the LSOA belongs to and the SIS score. This further highlights the differences in the location of people at risk of social isolation by age group.
Young people aged 0 to 15 years:
- LSOA - E01017236 - Redbridge - SIIS score 7.44
- LSOA - E01017210 - Millbrook - SIIS score 7.05
- LSOA - E01017274 - Woolston - SIIS score 6.14
- LSOA - E01017167 - Thornhill - SIIS score 6.05
- LSOA - E01017205 - Harefield - SIIS score 6.04
Working age population aged 16 to 64 years:
- LSOA - E01017281 - Woolston - SIIS score 14.26
- LSOA - E01017167 - Thornhill - SIIS score 12.91
- LSOA - E01017163 - Thornhill - SIIS score 10.84
- LSOA - E01017207 - Millbrook - SIIS score 9.91
- LSOA - E01017168 - Thornhill - SIIS score 9.83
Older people aged 65 years and over:
- LSOA - E01017182 - Coxford - SIIS score 11.82
- LSOA - E01017235 - Portswood - SIIS score 8.11
- LSOA - E01017250 - Shirley - SIIS score 7.83
- LSOA - E01035443 - Swaythling - SIIS score 7.76
- LSOA - E01035444 - Bargate - SIIS score 7.68
All ages:
- LSOA - E01017182 - Coxford - SIIS score 15.00
- LSOA - E01017250 - Shirley - SIIS score 8.81
- LSOA - E01017211 - Millbrook - SIIS score 8.69
- LSOA - E01017281 - Woolston - SIIS score 7.75
- LSOA - E01017241 - Redbridge - SIIS score 7.52
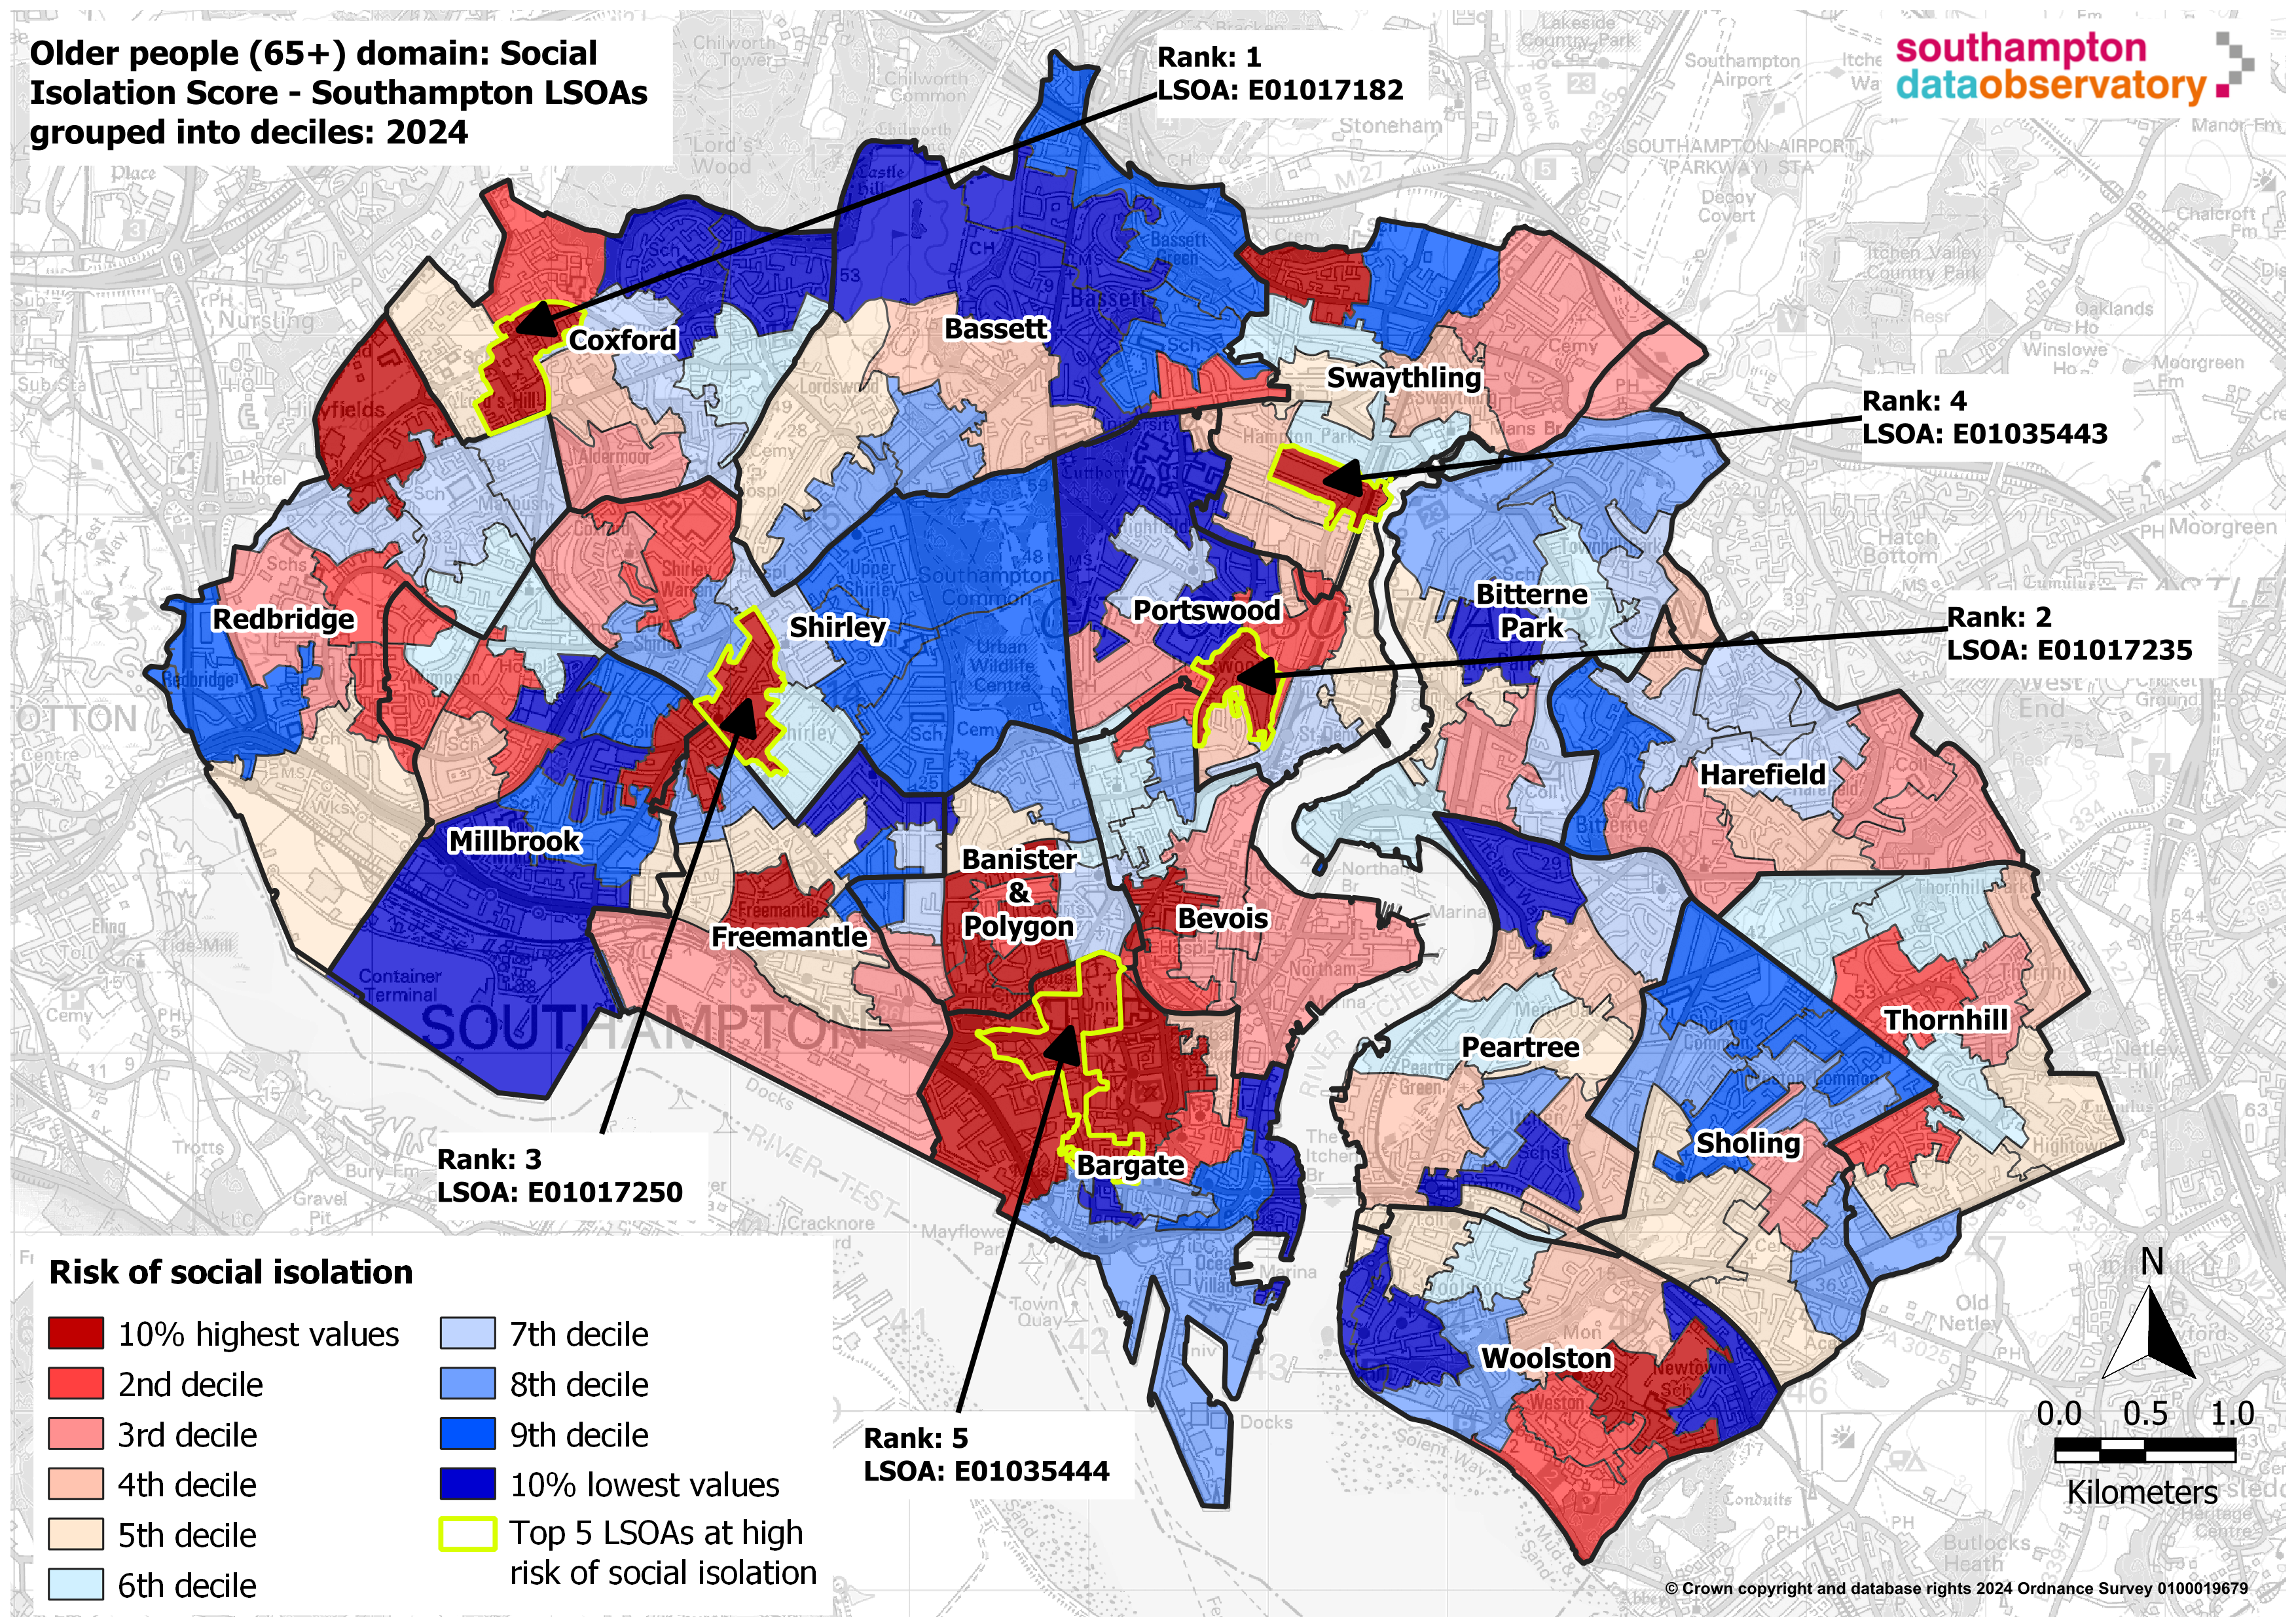 Of the 152 2021 LSOAs, 4 appear twice across the domains. LSOA E01017167, which is within the Thornhill ward, is the 4th LSOA at highest risk of social isolation for young people, and the 2nd highest risk for people of working age. LSOA E01017182 within the Coxford ward has the highest risk of social isolation in older people and in all age. In Shirley ward, LSOA E01017250 is the 4th highest risk for older people and 2nd for all ages. LSOA E01017281 situated in Woolston ward is most at risk of social isolation for working age and 4th for all age. One LSOA in particular, E01017182 situated in the Coxford ward, is most at risk of social isolation for Older People and All Age.
Although the LSOAs are different, Thornhill ward is featured heavily in the top 5 for Working Age (3 LSOAs) and Young People (1 LSOA), however is not in the top 5 for Older People or All Age. There is a clear difference between what wards include high social isolation risk LSOAs between young people and working age to older people. Young people are most at risk on the outskirts of the city, for working age it is in the East and older people it is North and Central.
The map is an example of social isolation in older people aged 65 years and over. All the maps at the different life stages across Southampton as well as the overall score can be found in the resources section. The results show some geographical similarities between the very high risk groups amongst young people and the working age population. This may be because both groups are experiencing social isolation for the same reason, for example if English is not the main language for the young people then it is unlikely to be the main language for the adults in the same household. Or the reasons for social isolation might be different but related, for example if an adult is socially isolated because of a long-term condition and a young person in the same household could be socially isolated because they are providing care for that adult.
Social Isolation Dashboard
Visualisation
Interventions
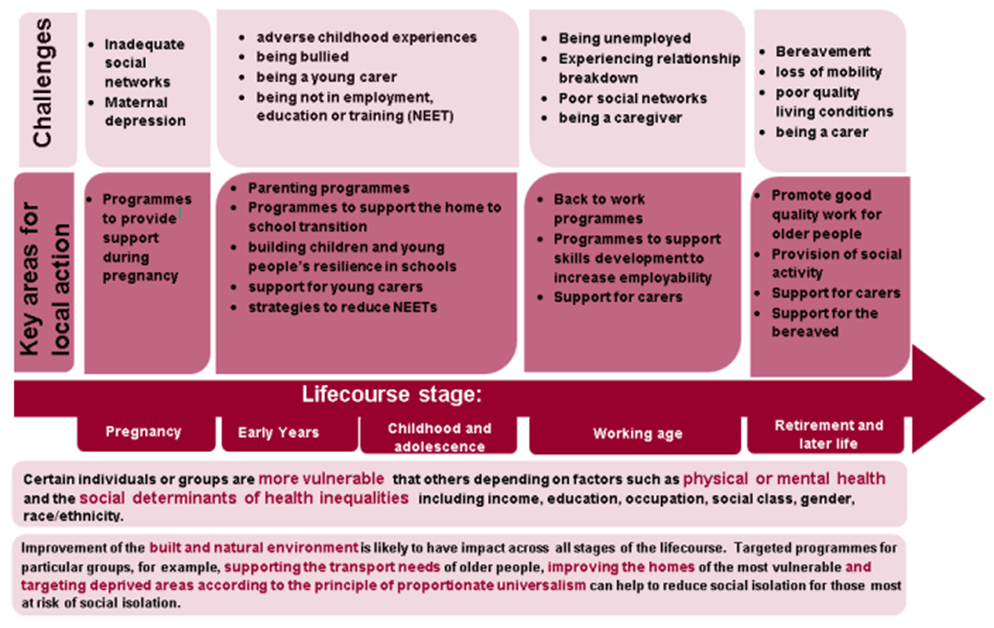 Tackling loneliness not only alleviates the suffering, and improves the quality of life, of individuals, but it also brings wider benefits to local communities. For example, tackling loneliness can reduce the demand for costly health, care and other interventions and, by reconnecting individuals to their communities, it can give renewed access to older people’s economic and social capital. Solutions to tackle loneliness and social isolation will vary depending on the age range. Reducing social isolation across the lifecourse by Public Health England discusses a range of interventions at different stages of the life course, for particular at-risk groups and interventions for all stages of life.
The WHO’s advocacy brief on social isolation and loneliness among older people details interventions and strategies to reduce social isolation and loneliness. Below are just a few examples of ways that can reduce social isolation and loneliness. Further publications and research can be found in the resources section.
Reducing stigma
The results of the Loneliness Stigma Rapid Evidence Assessment (REA) found that some people (including people who are and are not experiencing loneliness) do hold stigmatising views of loneliness; however these are not universal and tend to be grounded in stereotypes of people who feel lonely. People experiencing loneliness had described fears of being judged or rejected and had feelings of embarrassment or shame. Loneliness stigma can prevent people from talking about their experiences of loneliness and seeking help. This results in service providers (and more informal support providers such as family and friends) being unable to identify and help people experiencing loneliness, meaning that their needs go unmet.Already action has been taken nationally and locally to reduce stigma by directly supporting those who are lonely and socially isolated, enabling them to have open conversations and address self-stigma carefully. Campaigns have sought to change the narrative around loneliness. Continuing evidence is needed to understand what is and isn’t working in reducing sigma.
Social prescribing
Social prescribing is a means of referring people to a range of local, non-clinical services in order to take a holistic approach to people’s needs and support individuals to take more control of their health. Many schemes are focused on improving mental health and physical wellbeing and people who have mild or long term mental health problems, complex needs, socially isolated and multiple long term conditions can benefit. (What is social prescribing? | The King's Fund (kingsfund.org.uk))
Many social prescribing schemes have the potential to support practical action, including changing the conditions in which people are living. In October 2019, the Government announced the establishment of a national academy of social prescribing. In the Marmot Review, it states “This is welcome but it must include a strong focus on activities to improve the conditions of daily life – through housing and financial advice, for example – as well as supporting behaviour change. More research is needed into the possible impacts that social prescribing might have on inequalities.”
Volunteers
Volunteering, at any age, can be a great way to meet new people and engage with the community. It exposes you to people with similar interests and improves ties within the community. Equally volunteers can support people who are socially isolated and lonely.
Digital inclusion
Improving digital skills, mainly in the older generations, helps access a wider range of support and enables people to connect with their families and community more. Affordable access to smartphones, laptops or tablets means people are more likely to buy one and use what’s available. It is still vital to keep non-digital options accessible to give people a choice.
Transport and access to services
Having affordable, reliable and suitable transport helps all people, especially older people, to stay connected with their community and engage in social events. Having a variety of different transports supports all people in being able to travel. Having travel schemes encourages people to use transport. Improving green spaces, public seating and safe pavements help make meeting people doable.
Resources
Social Isolation Dashboard
This dashboard shows sub-city areas at risk of Social Isolation within Southampton. The Social Isolation scores have been calculated using a method called Z-Scoring which normalises the different indicators into the same range then grouped into deciles to see which areas across the city are most at risk of social isolation.
Social Isolation Dashboard
Visualisation
Social Isolation score maps (2024)
These maps show areas of the city (in deciles) that are most at risk of social isolation. There are four main domains, Young people (0-15), Working age (16-64), Older people (65+) and All age.
All Age
Young People
Working Age
Older People
Methodology of Z-Scoring
This PowerPoint explains the methodology of Z-Scoring which has been used to calculate the Social Isolation Scores.
Z-Scoring methodology
Datasets relating to loneliness and social isolation
Information relating to loneliness and social isolation
Loneliness and social isolation publications
Government’s work on tackling loneliness
Website
Local action on health inequalities: reducing social isolation
Website
Combating loneliness: a guide for local authorities
Report
Loneliness and isolation: Social relationships are key to good health
Website
CO-OP Foundation: A friend in need
Report
Tackling loneliness evidence review: executive summary
Report
Loneliness Stigma Rapid Evidence Assessment (REA)
Website
WHO’s advocacy brief on social isolation and loneliness among older people
Report
Red Cross - Loneliness at work
Report
Age UK - Loneliness and COVID 19
Report
Southampton: Loneliness Social Isolation (2017)
Previous social isolation calculations for Southampton in 2017. Please note that these maps refer to old ward boundaries.
Loneliness and Social Isolation in Southampton: Intelligence briefing - April 2017
Southampton Social Isolation Index
Social Isolation Index - Map of Southampton: young people quintiles - April 2017
Social Isolation Index - Map of Southampton: Working Age Populations (WAP) quintiles April 2017
Social Isolation Index - Map of Southampton - older people quintiles April 2017
Social Isolation Index - Map of Southampton: overall quintiles - April 2017
Last updated: 30 May 2024